Visualization guide and gallery
pyGWRx plotting functions return Matplotlib figure/axes objects and do not call plt.show() automatically. This supports notebooks, batch reports, CI rendering, and publication pipelines.
Plot by analytical question
| Question | Plot family |
|---|---|
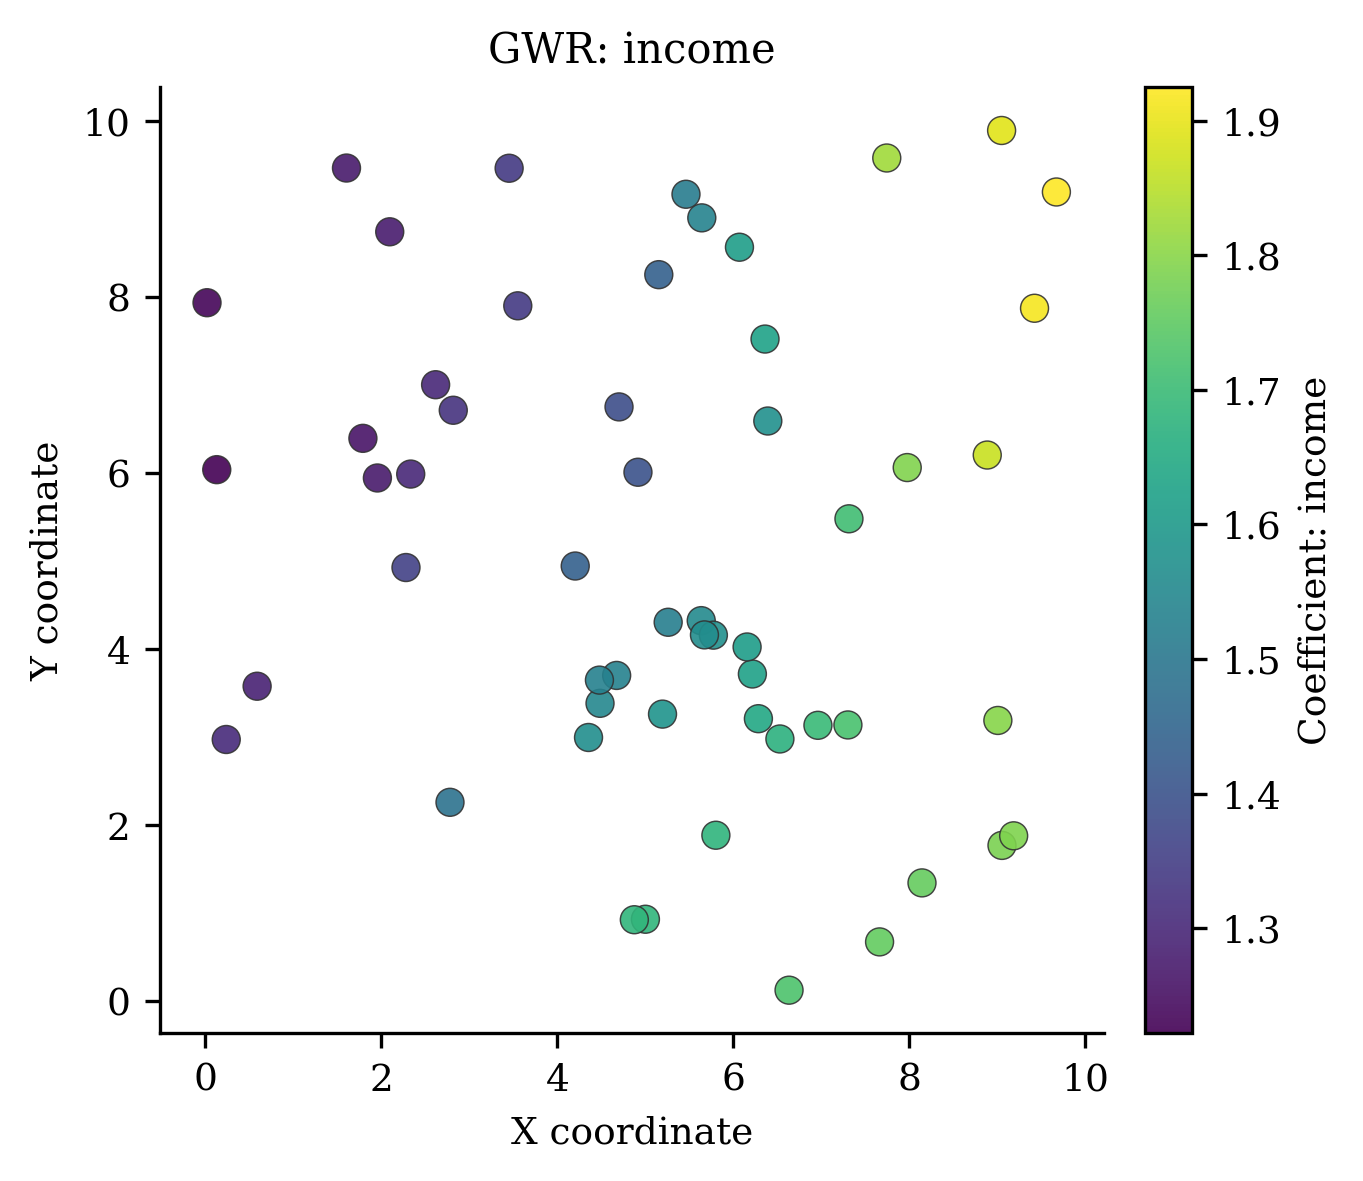
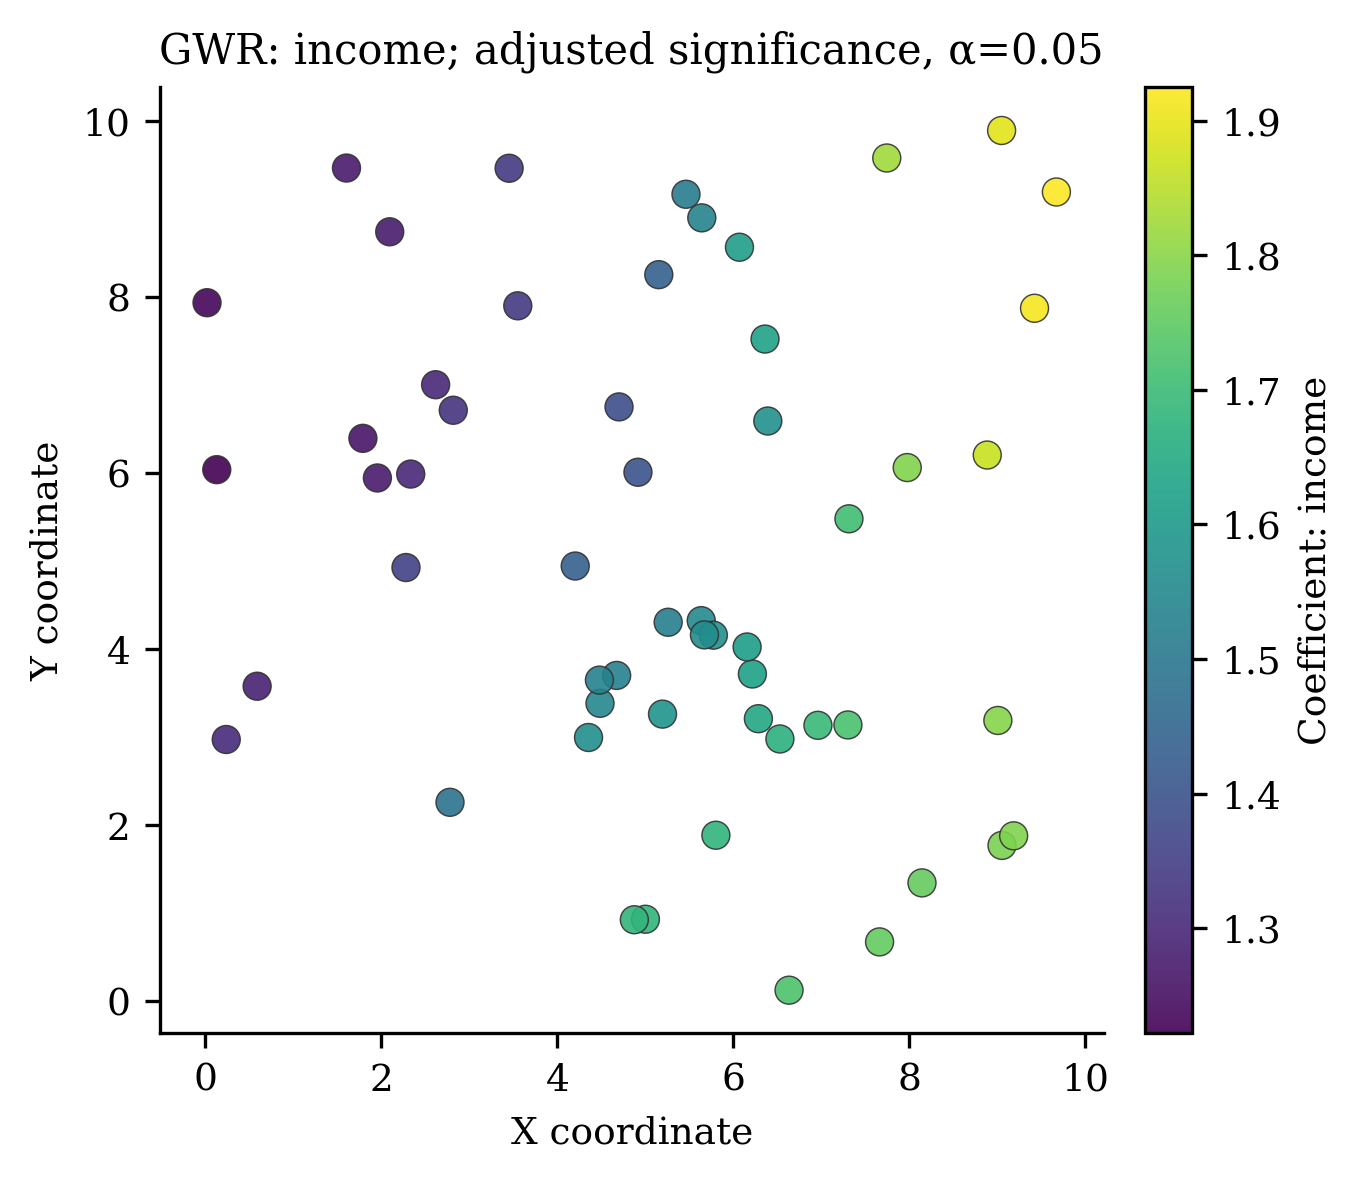
| Where is an effect strong? | coefficient/surface maps |
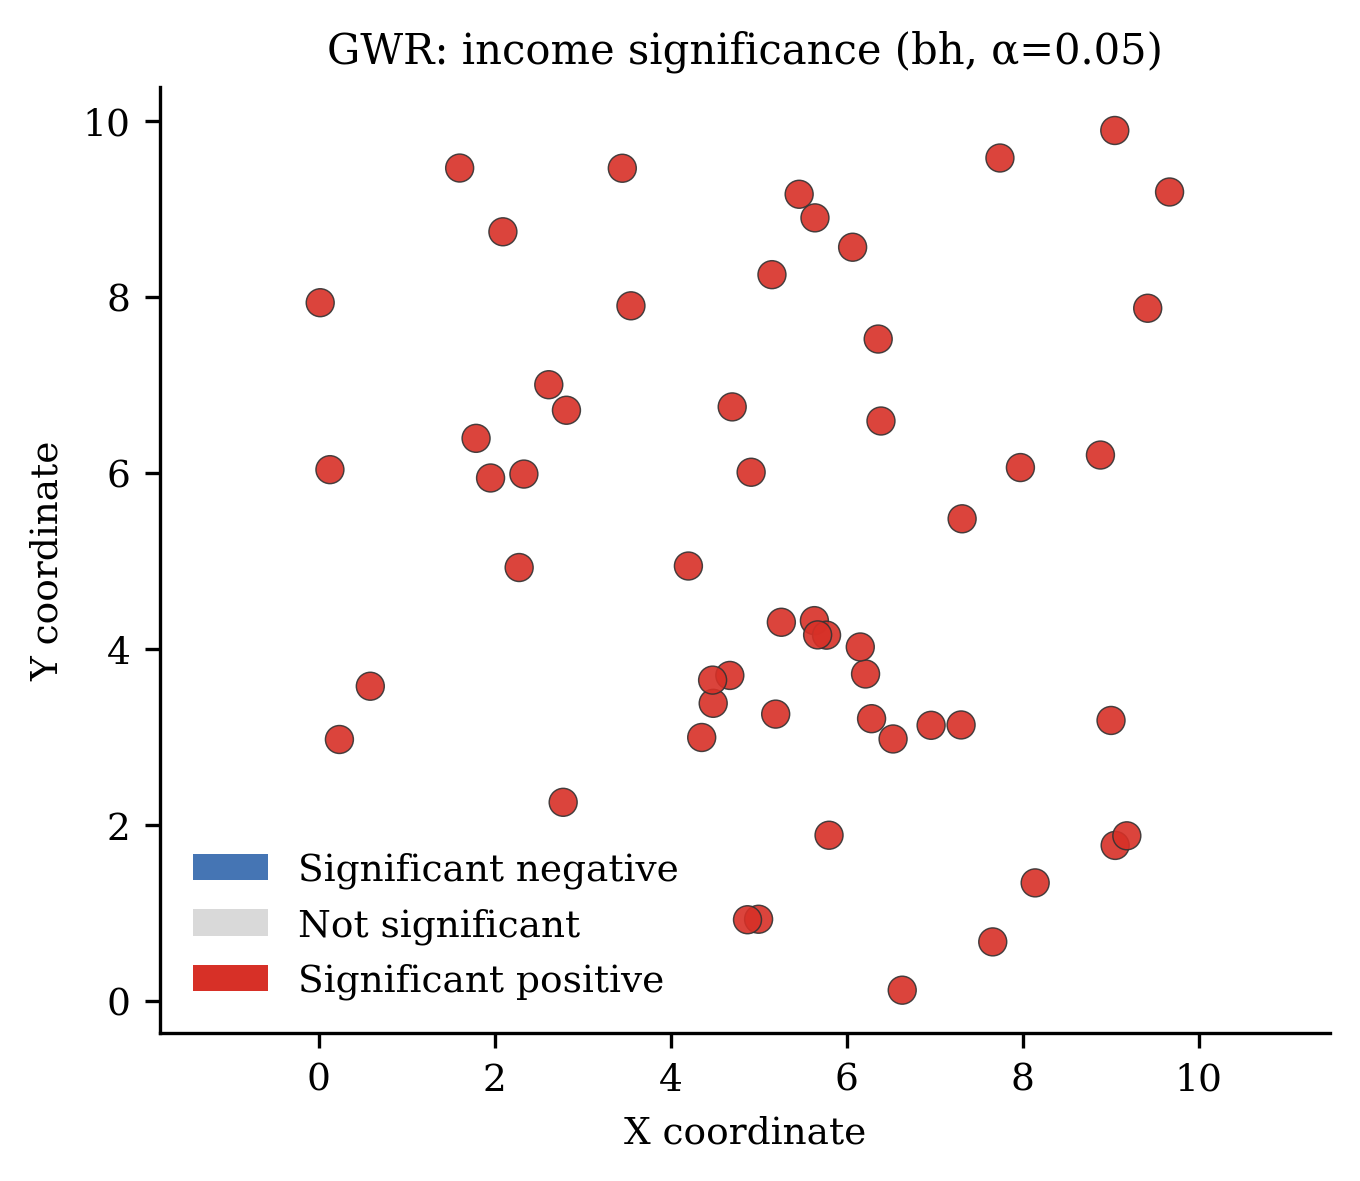
| Where is an effect supported? | significance maps |
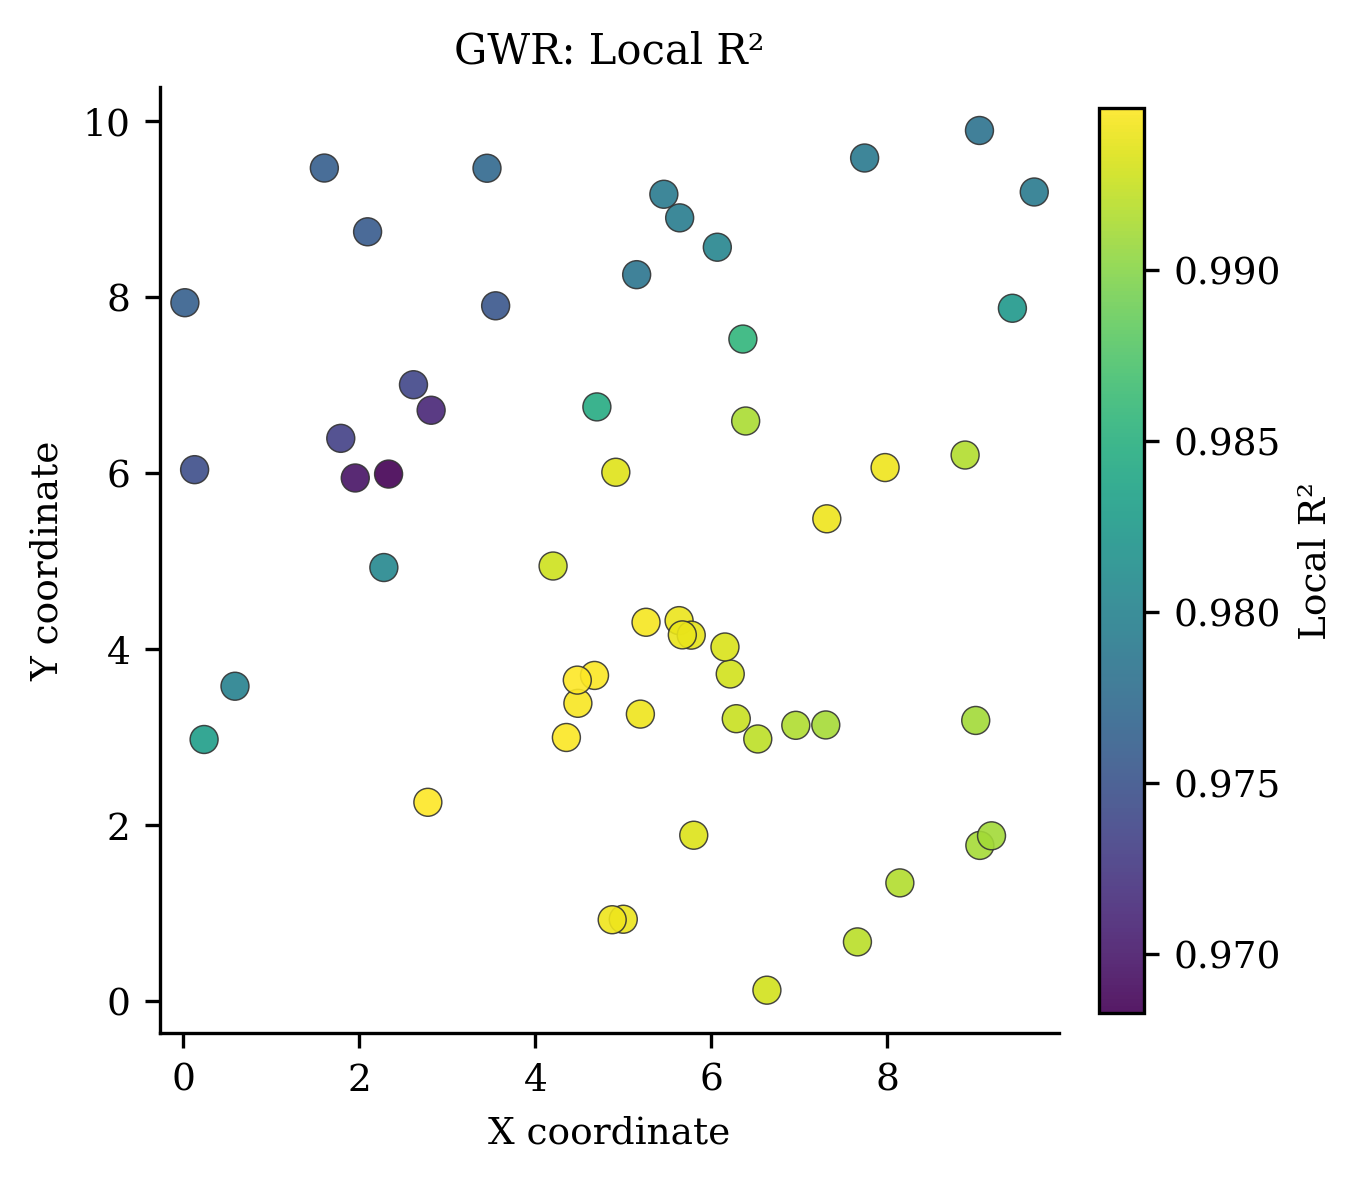
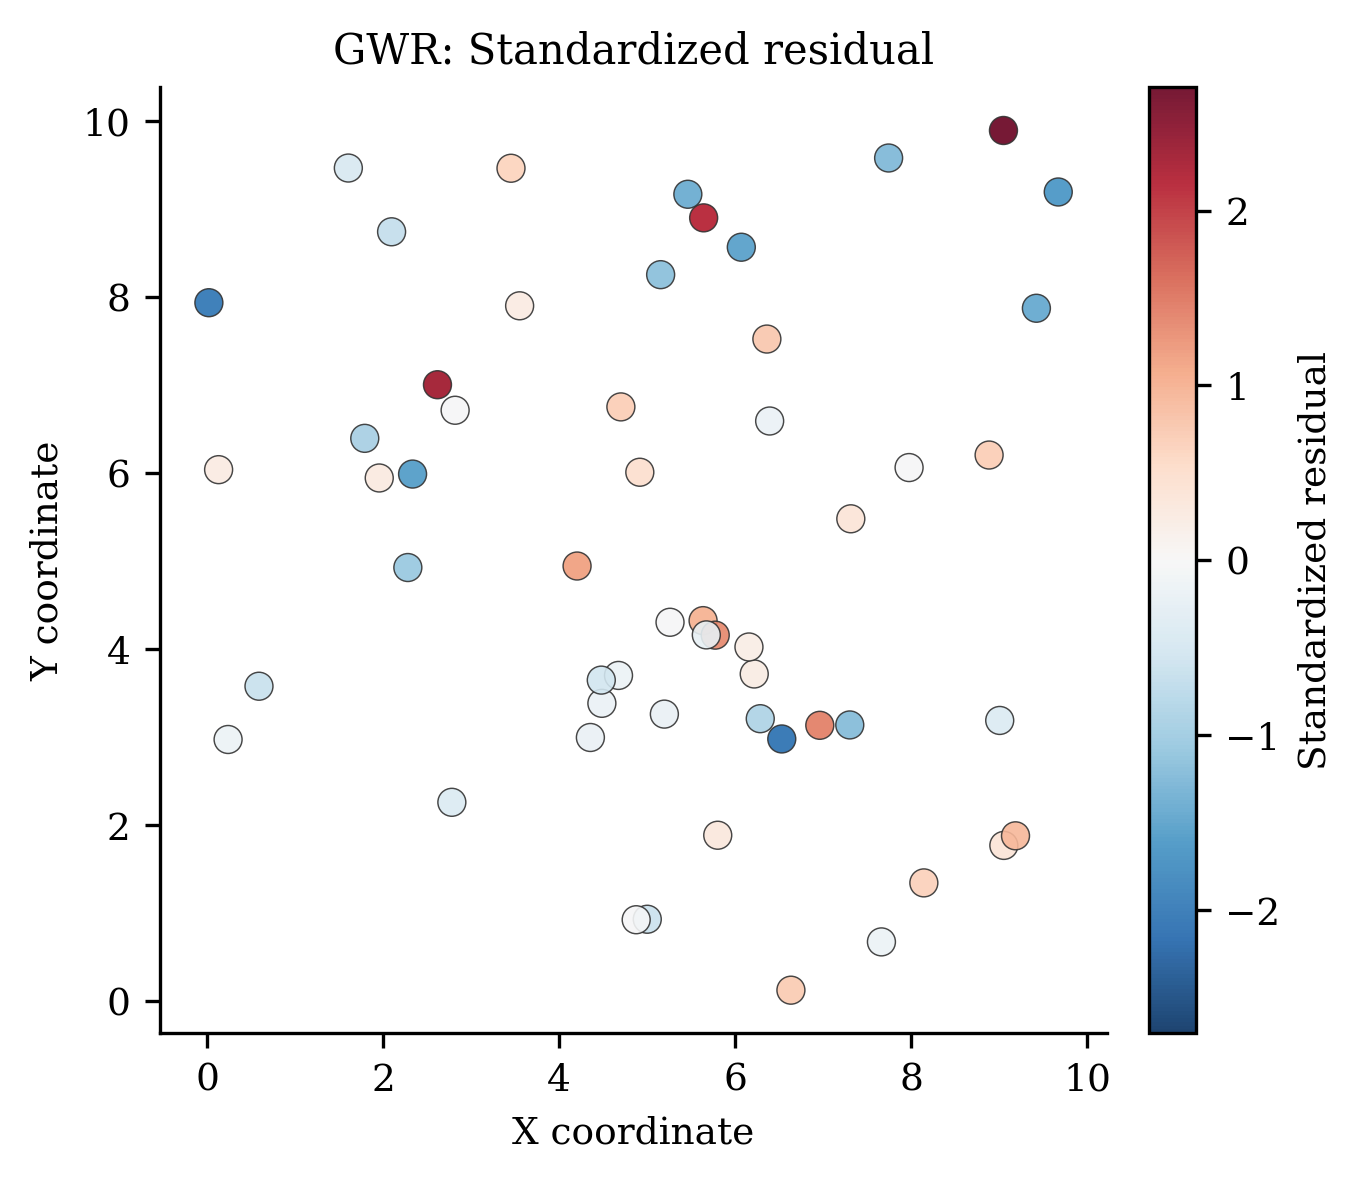
| Where does the model fit poorly? | local R², residual, observed-versus-predicted |
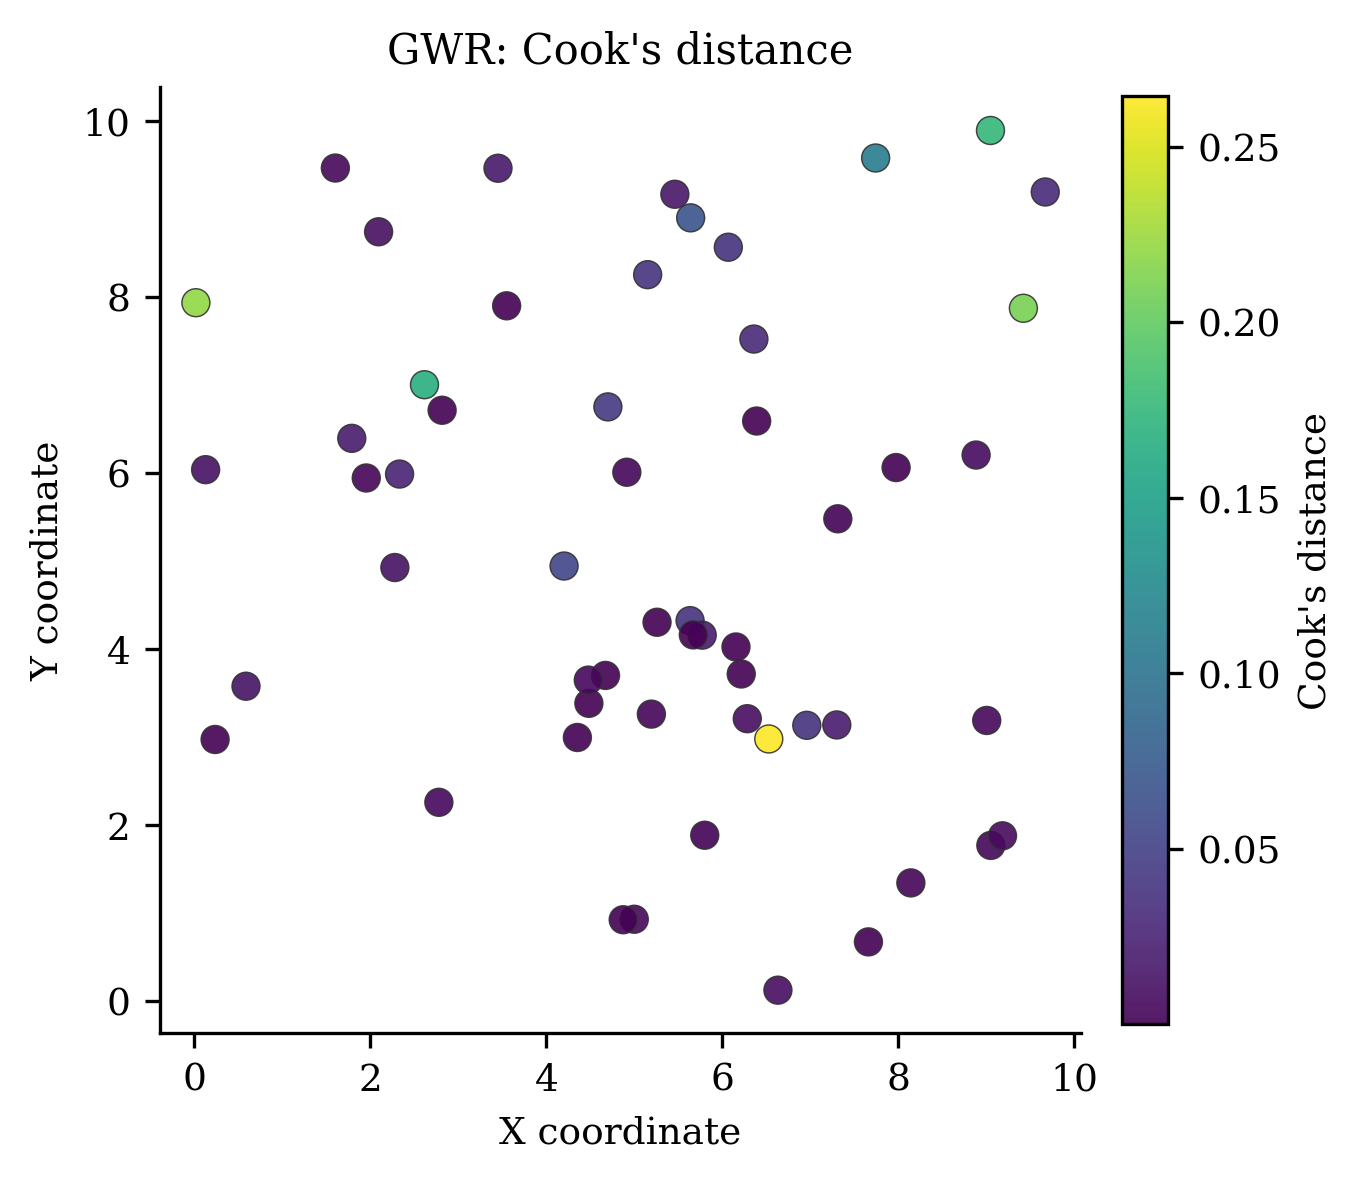
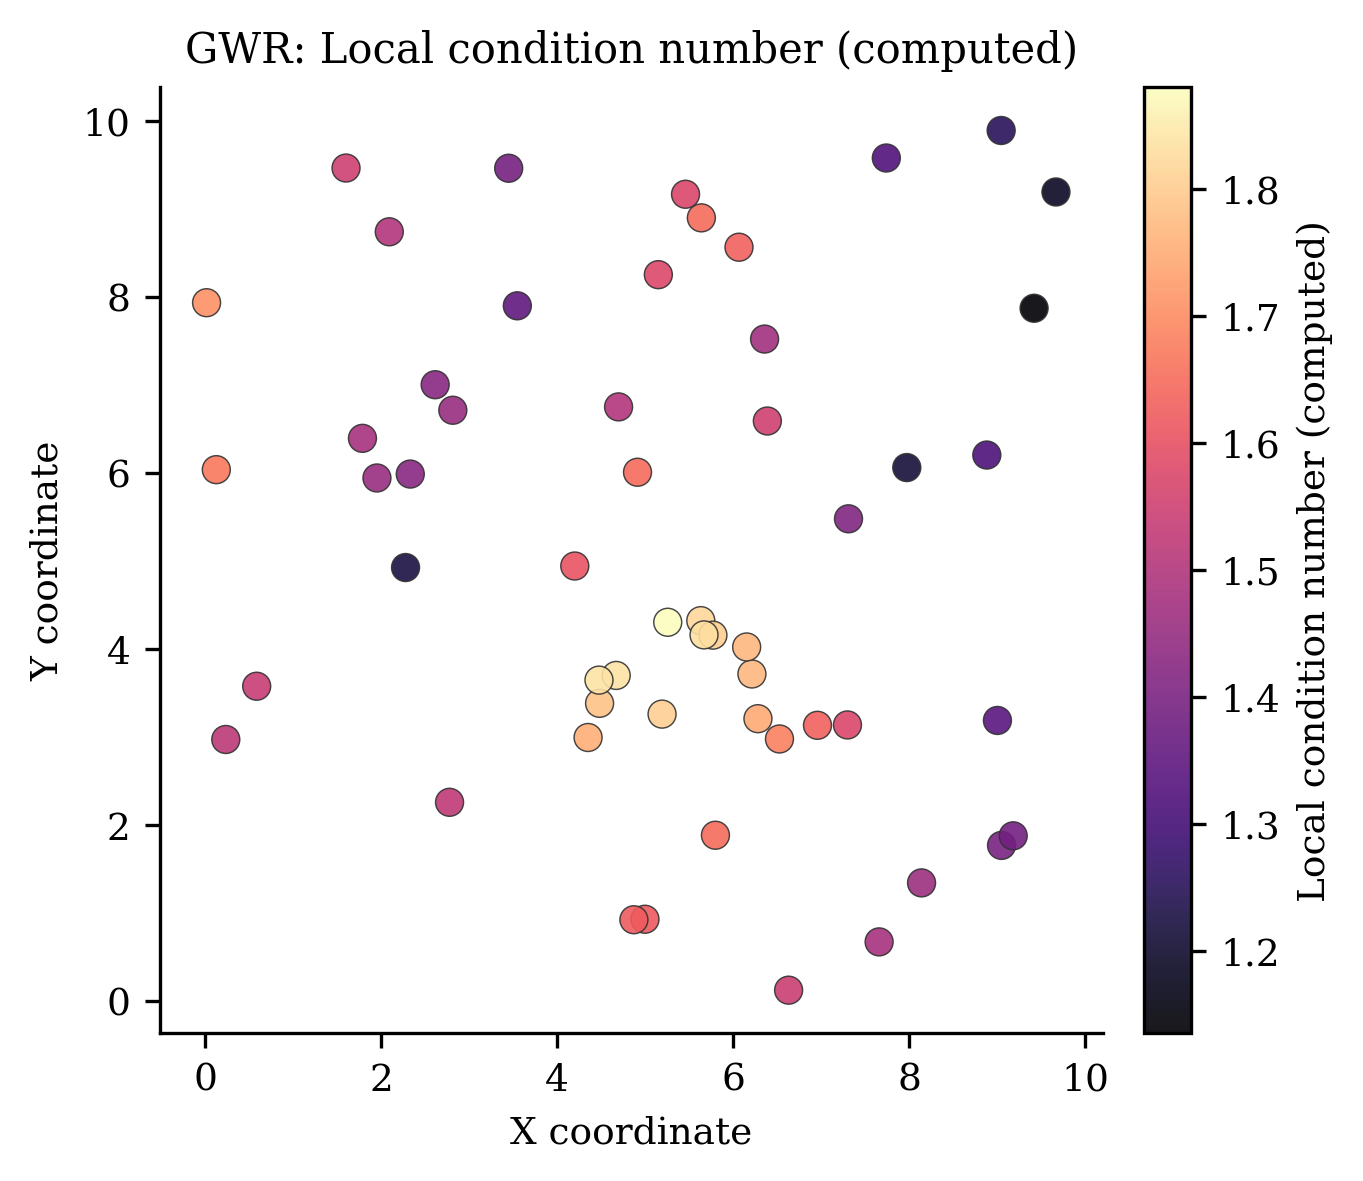
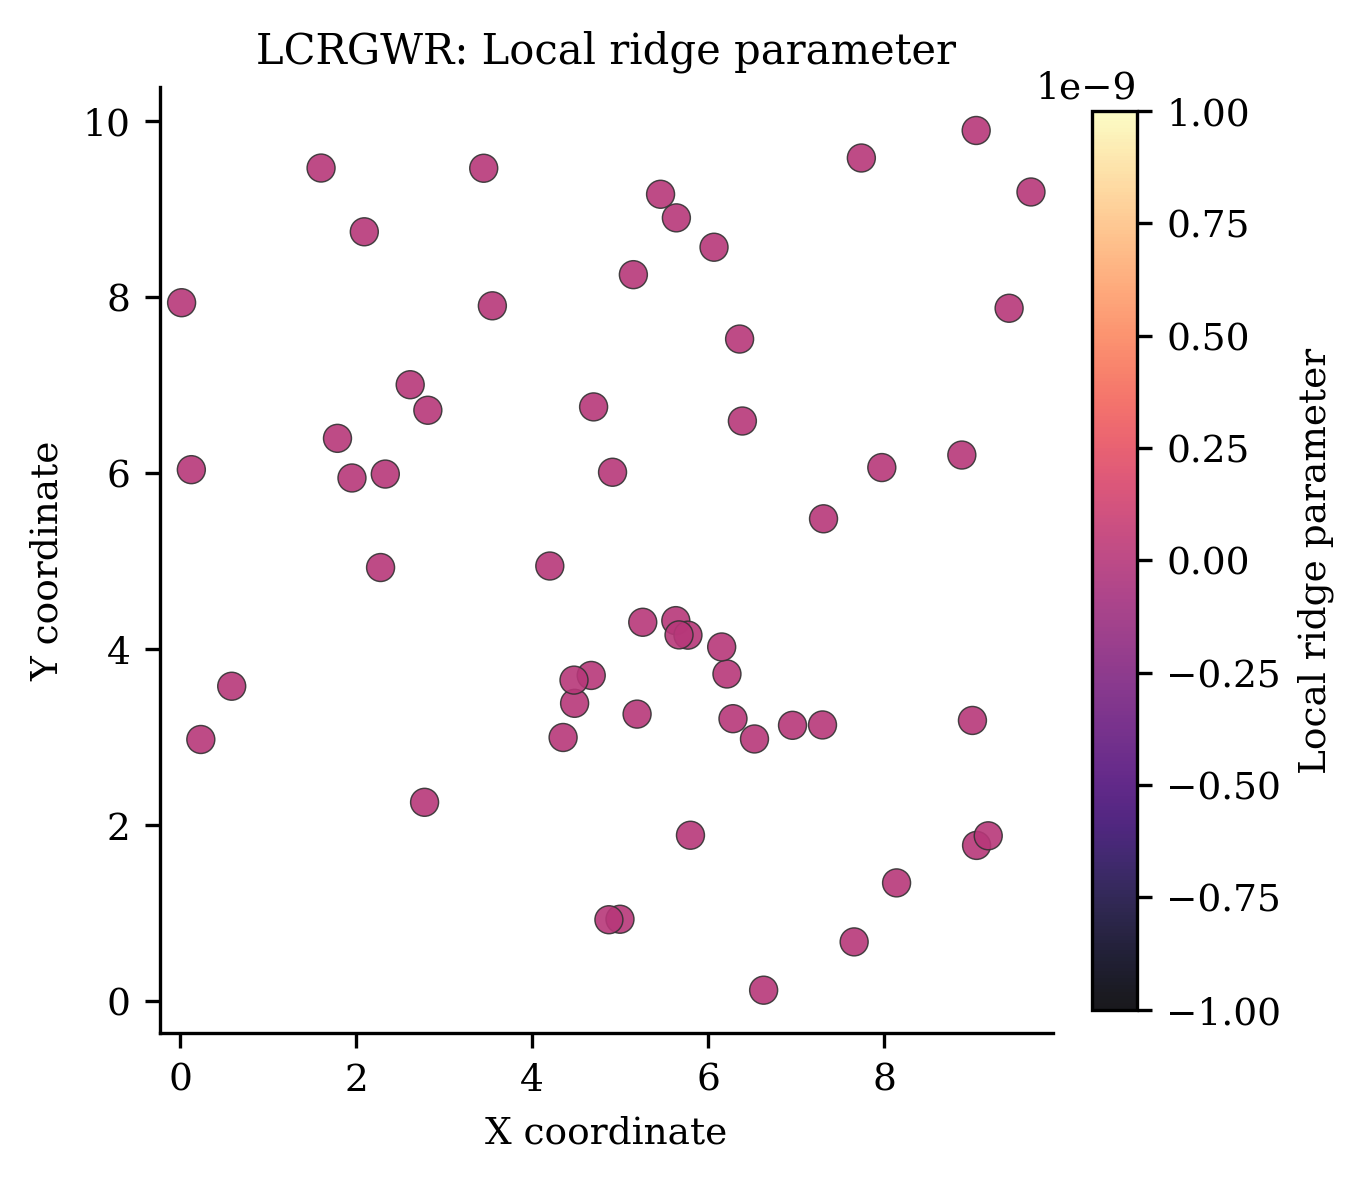
| Are estimates unstable? | collinearity and influence maps |
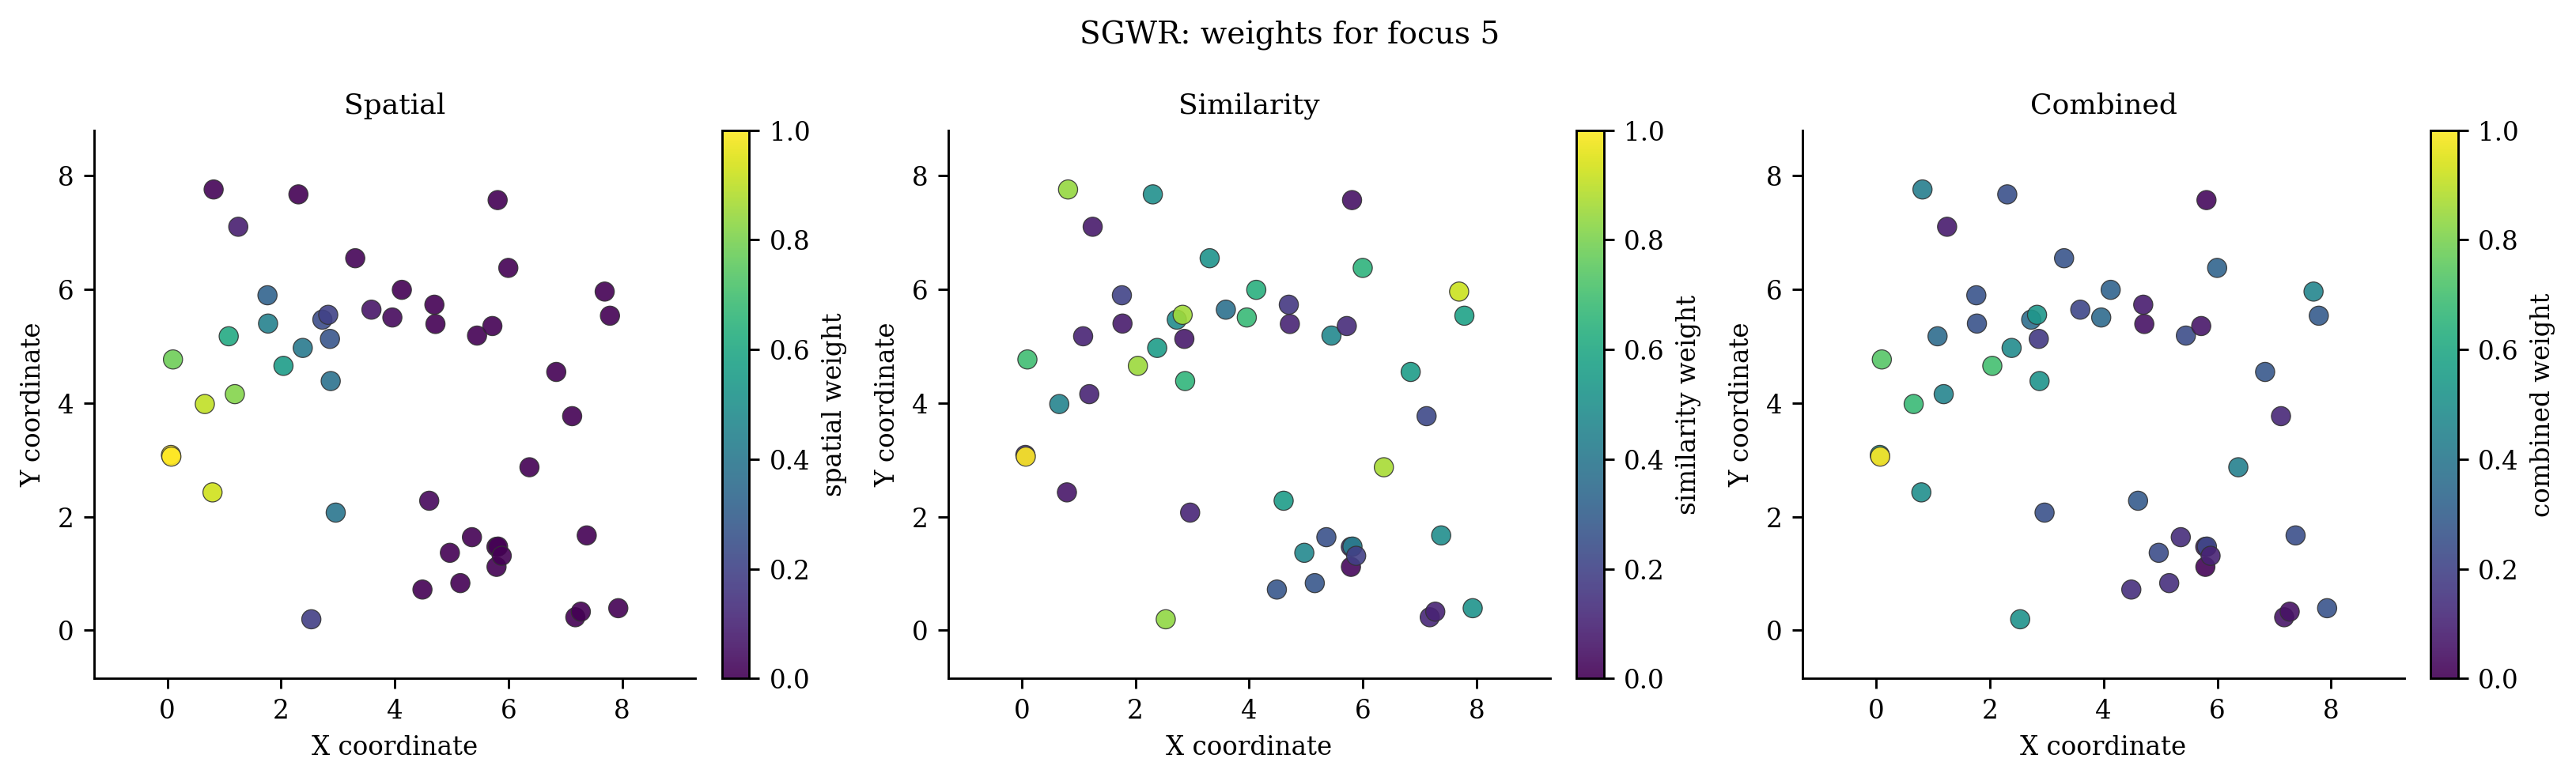
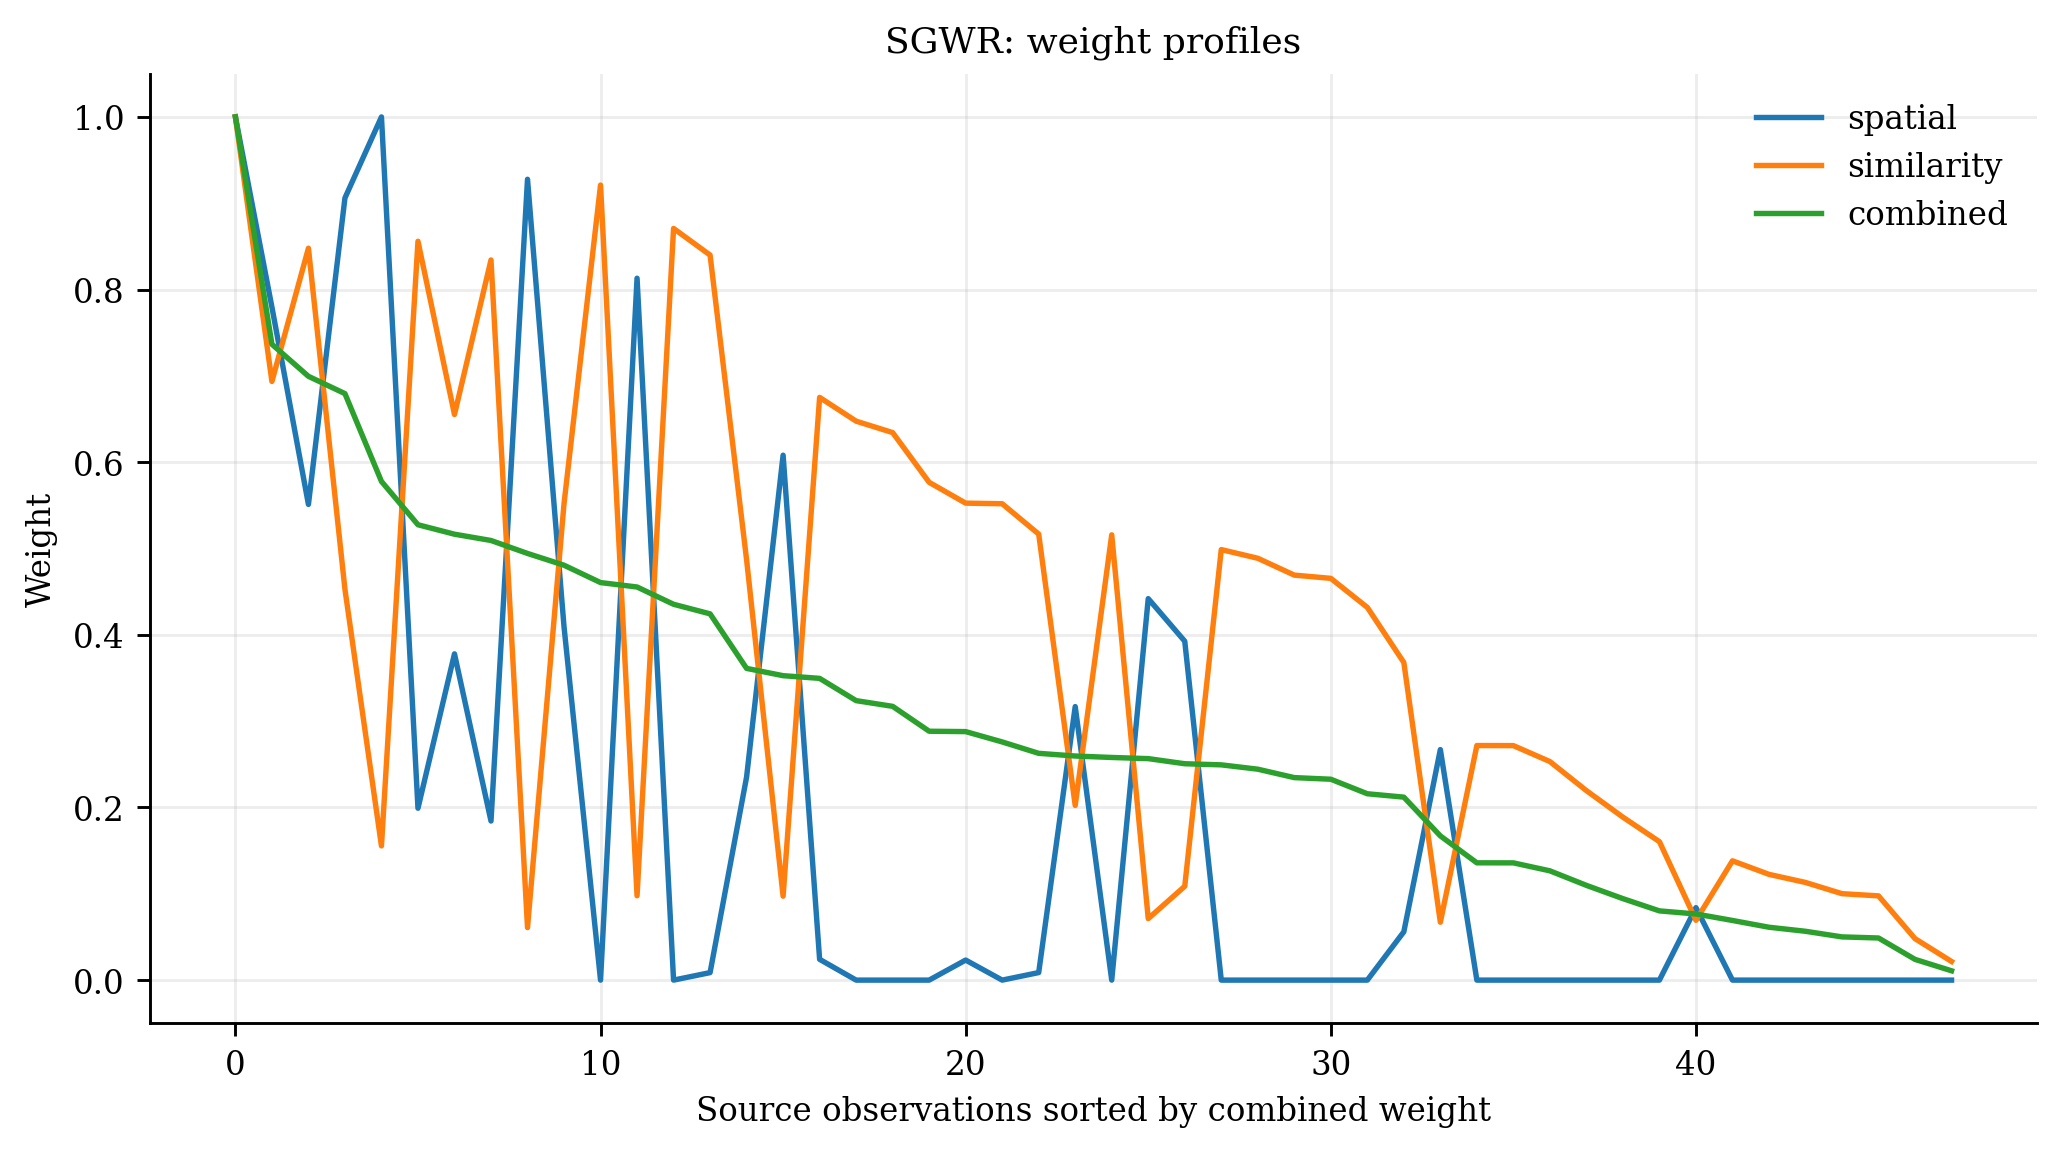
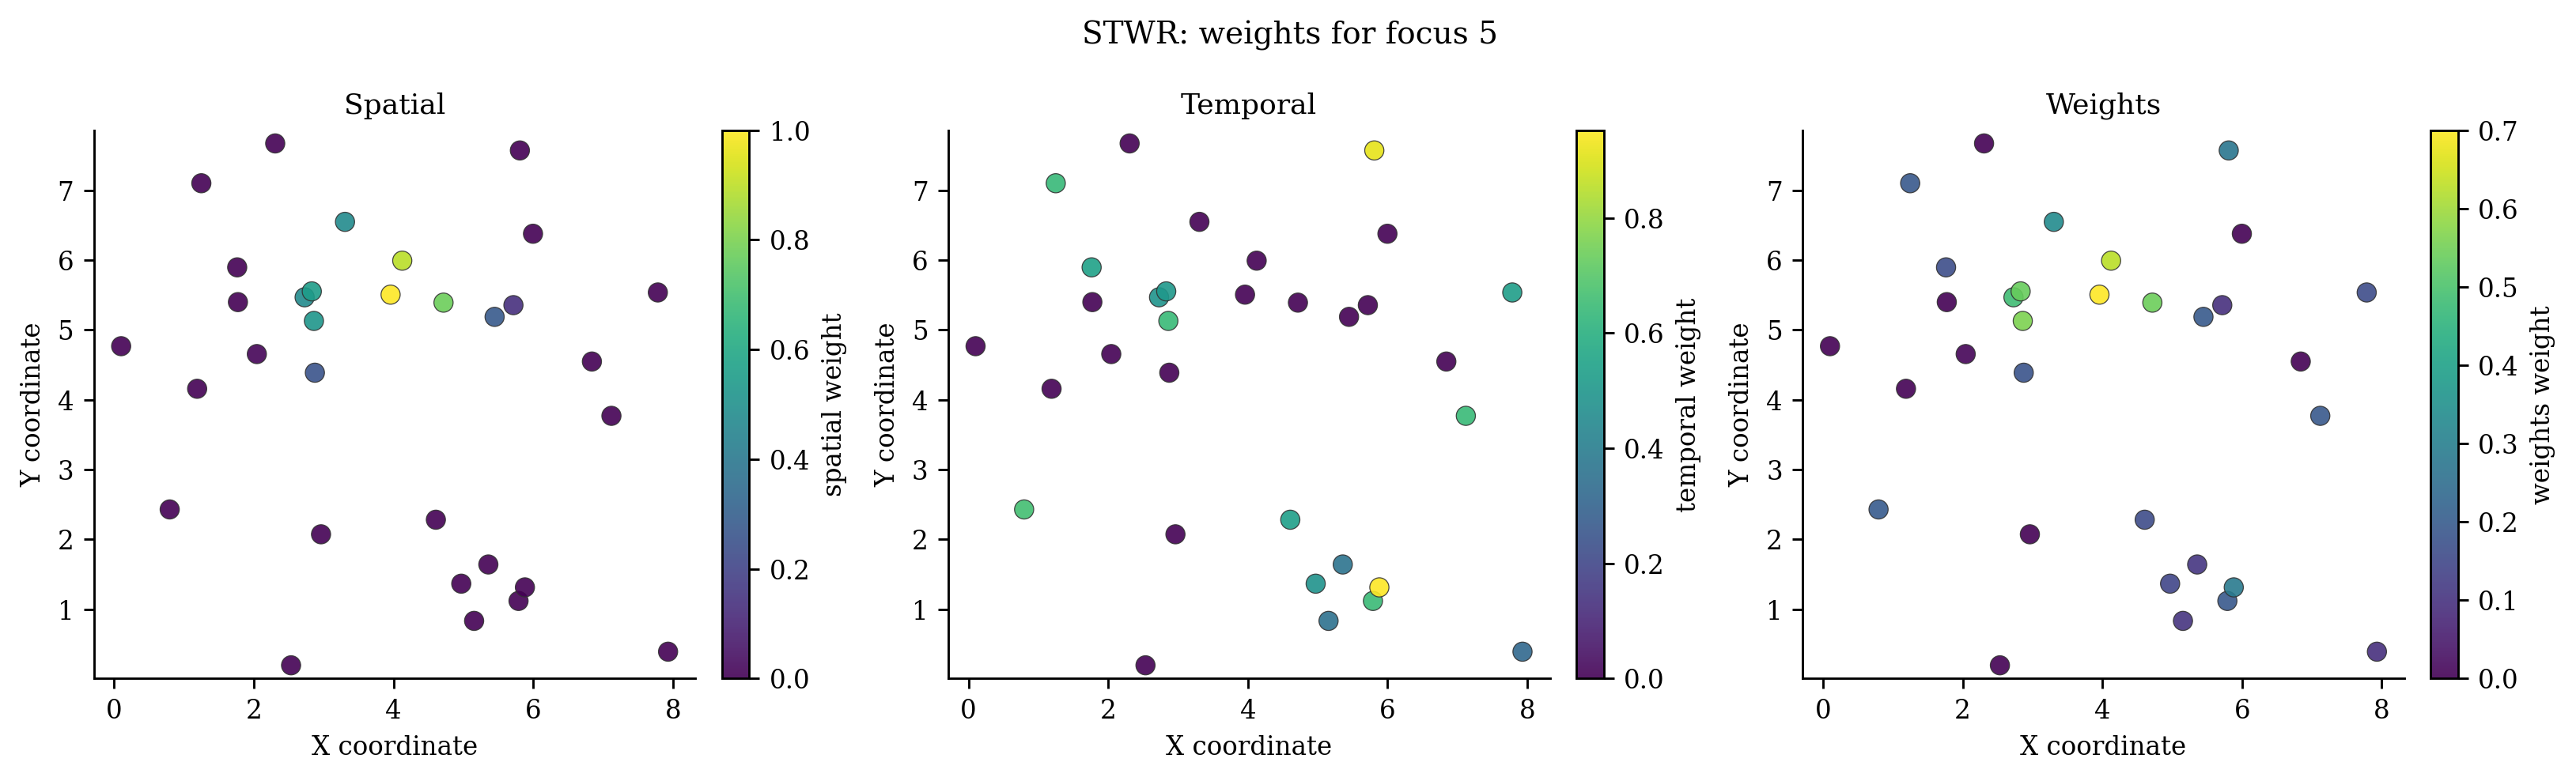
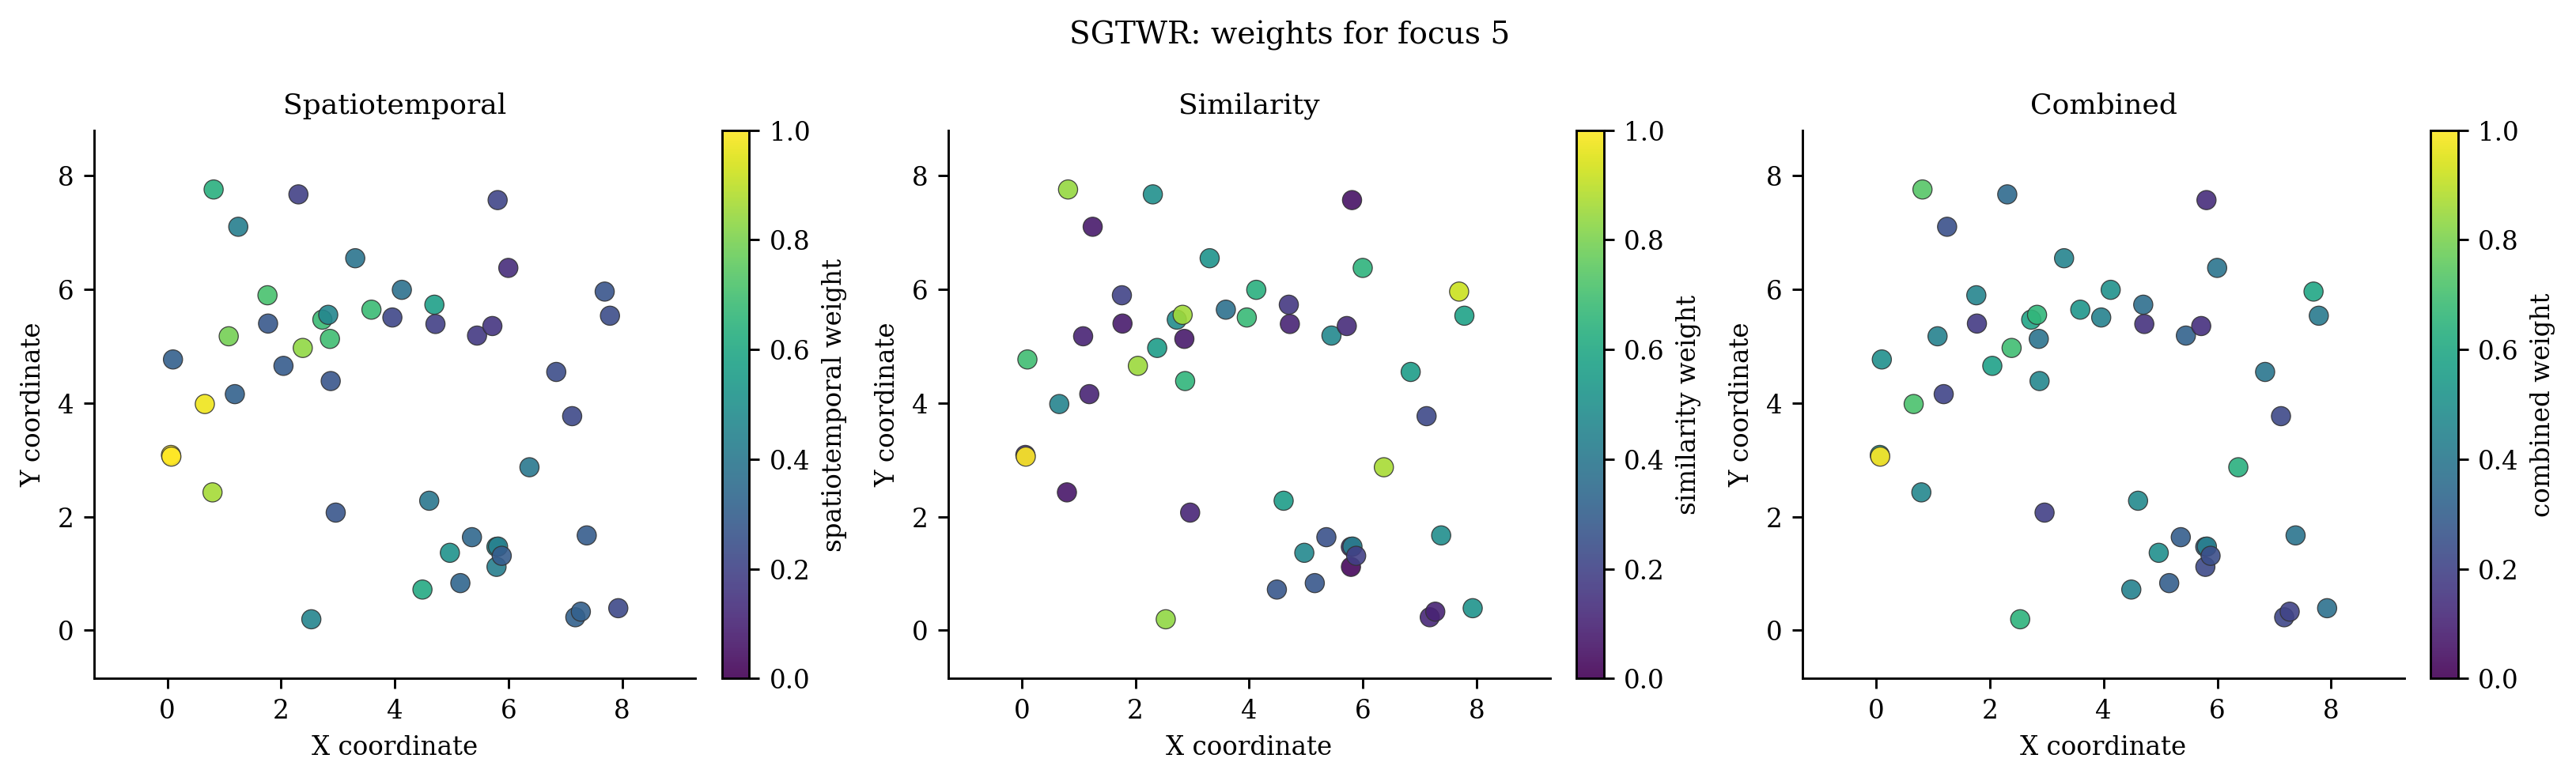
| What neighbourhood is used? | kernel profiles, temporal/similarity weight decomposition |
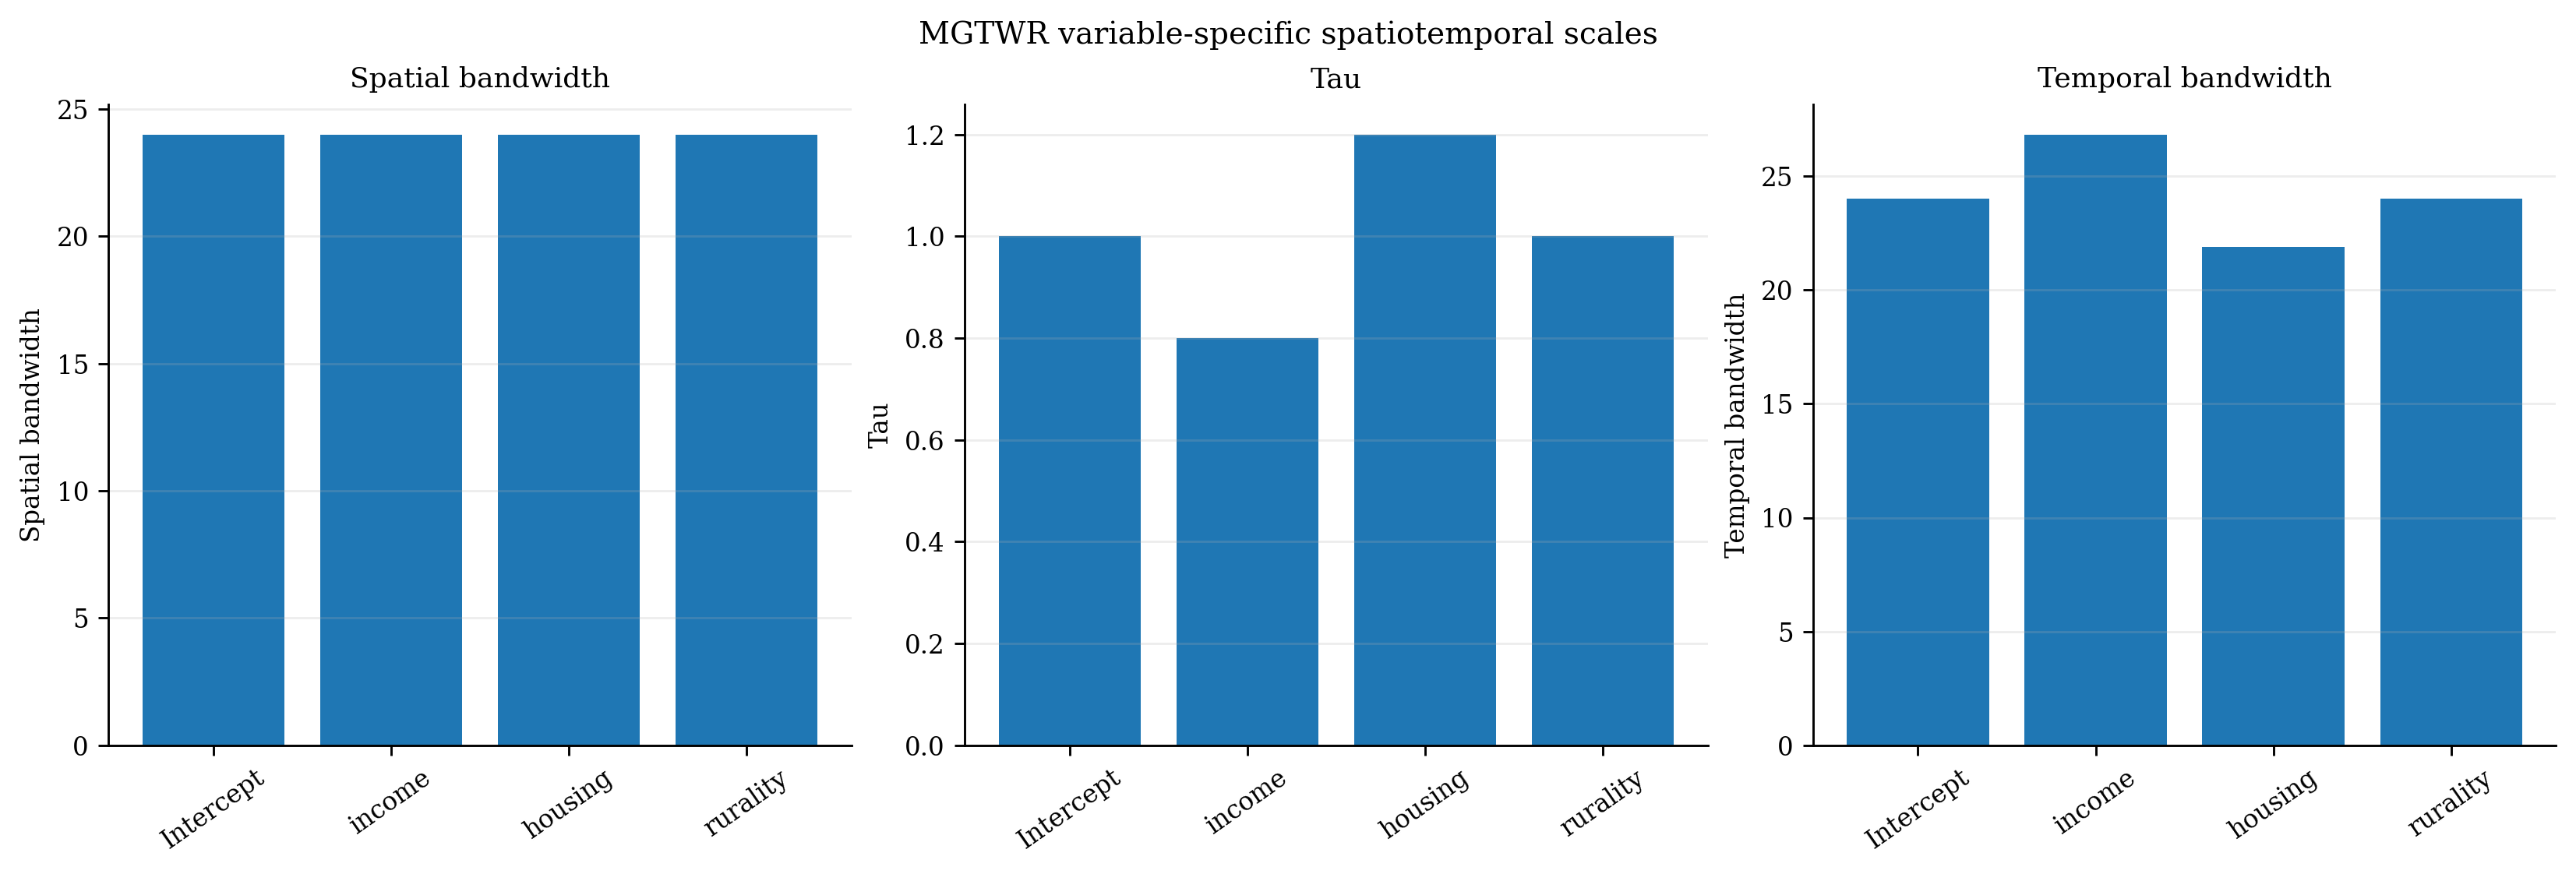
| Do variables operate at different scales? | MGWR/MGTWR scale plots |
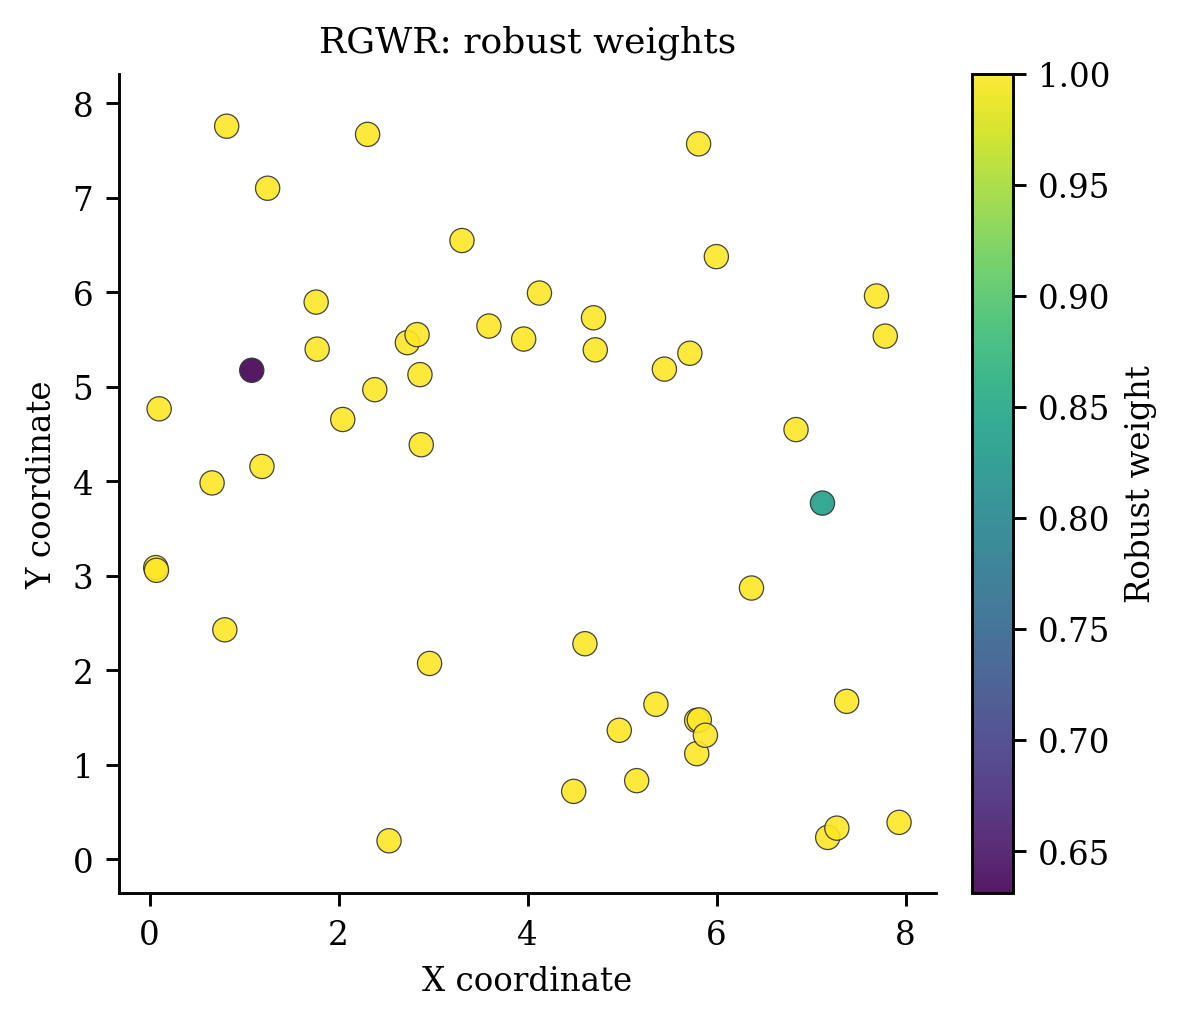
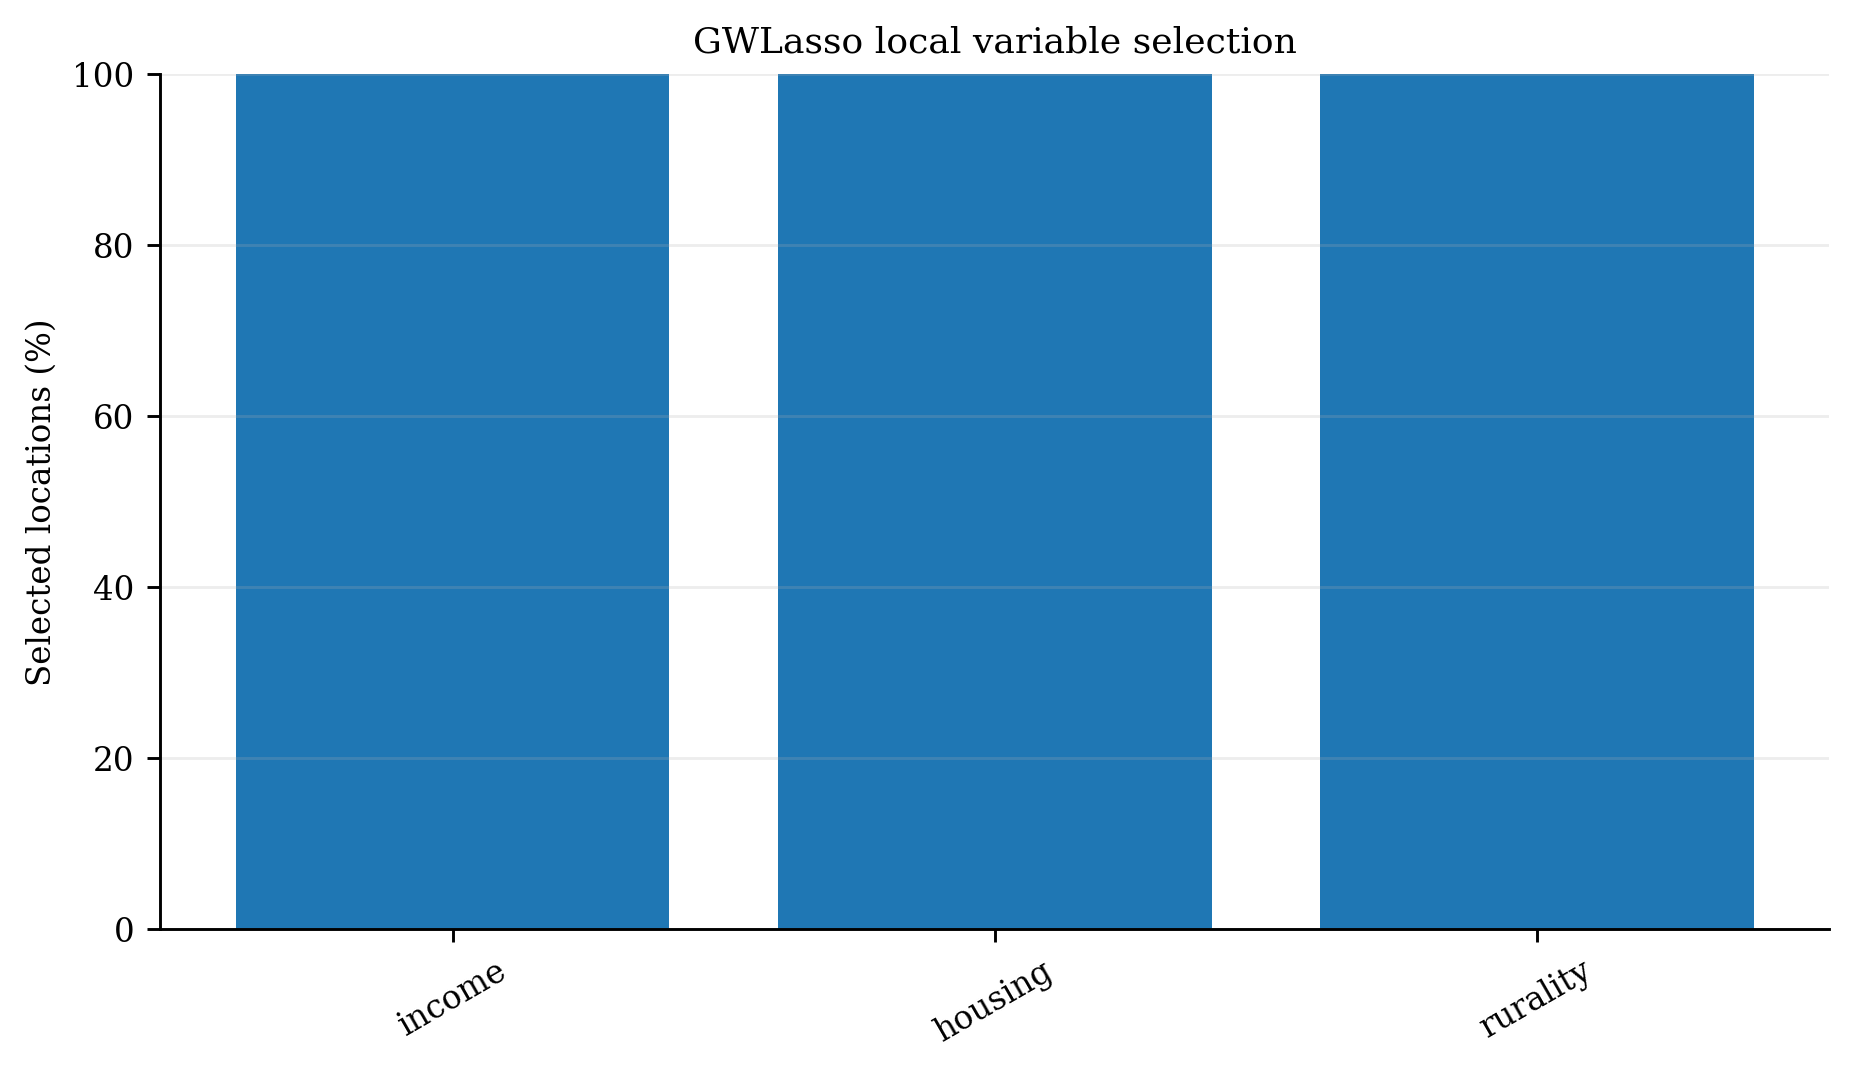
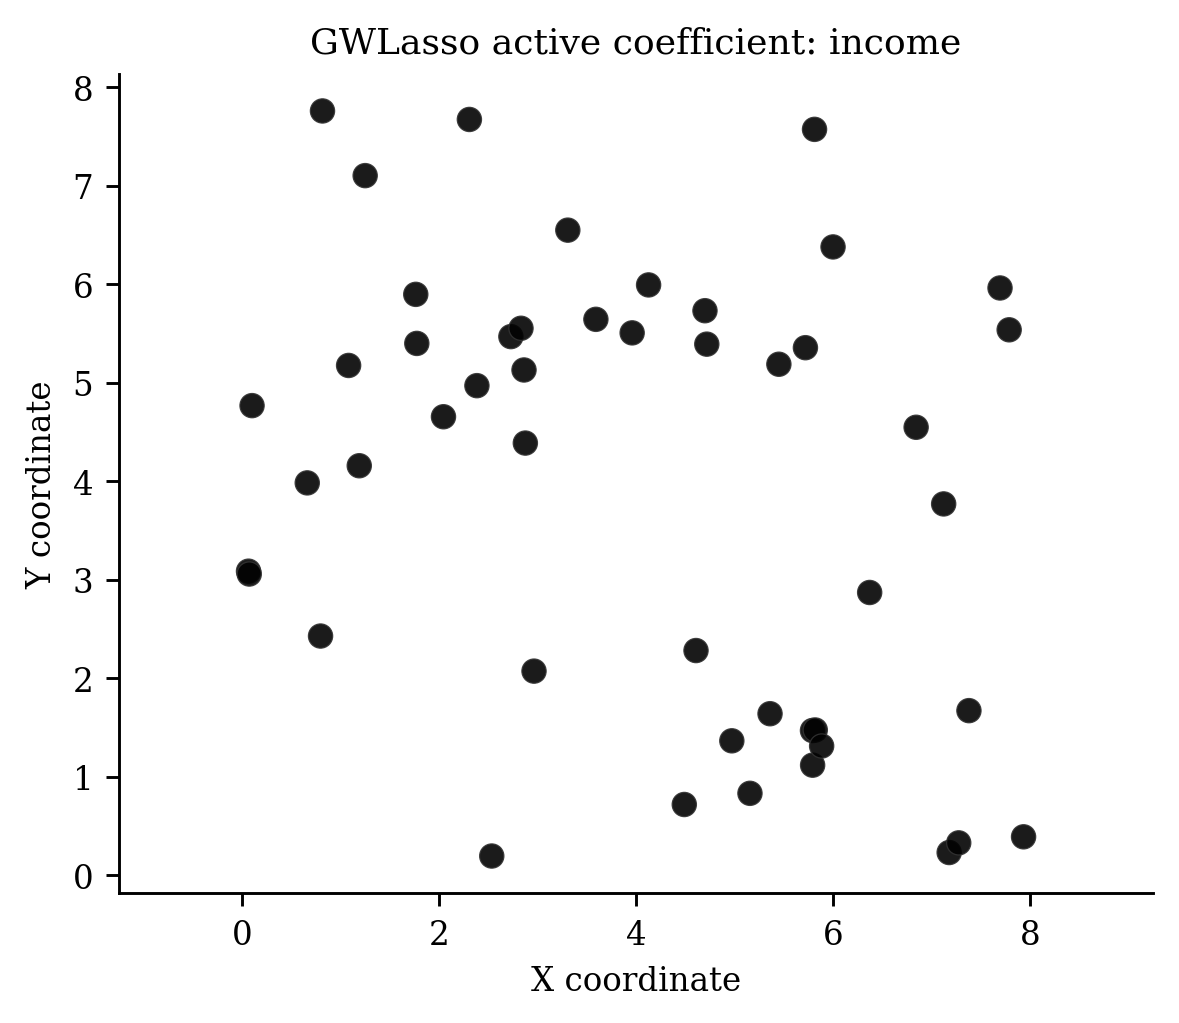
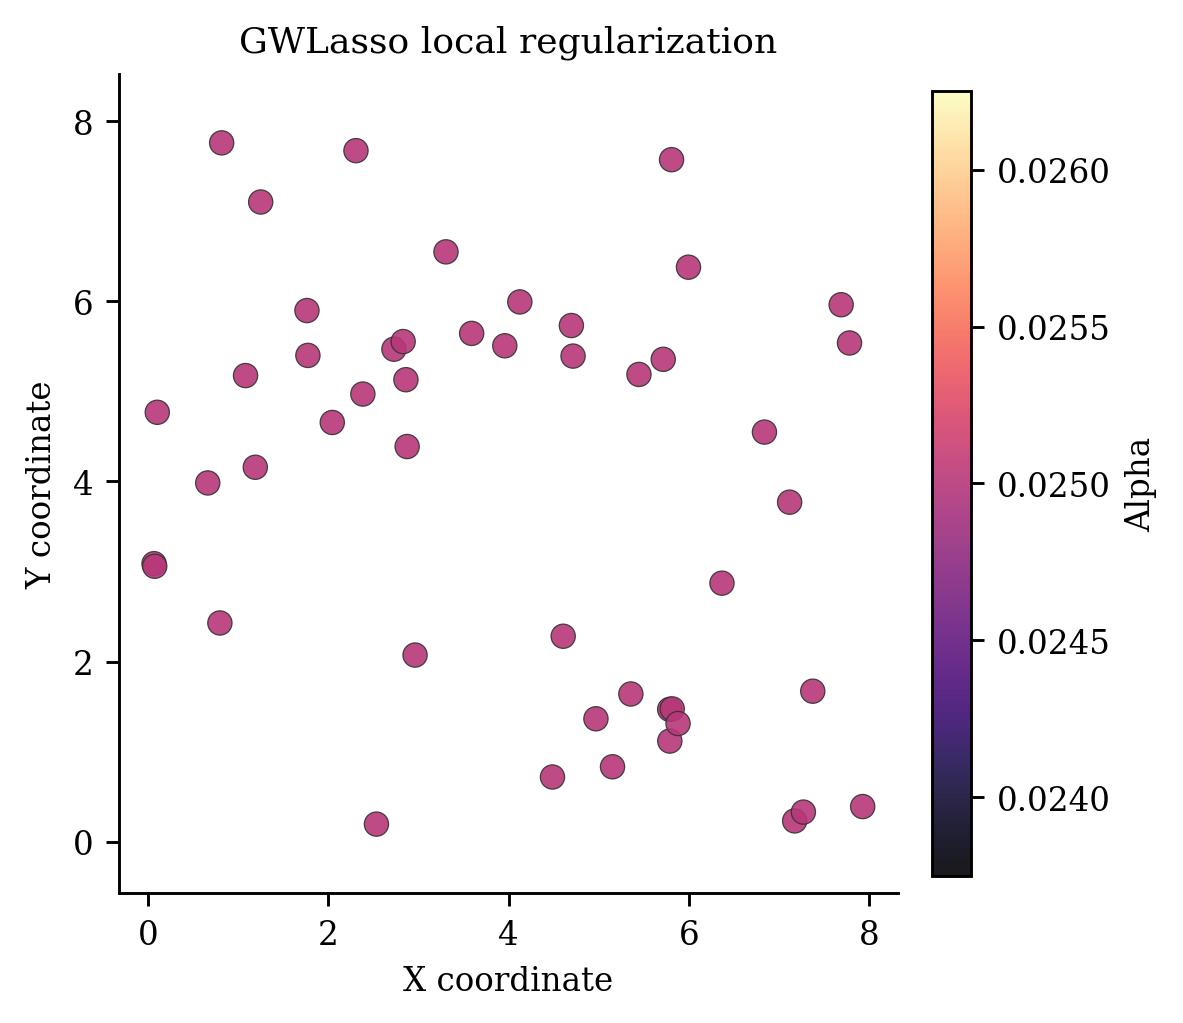
| Are outliers or variables selected locally? | robust weights and GWLasso plots |
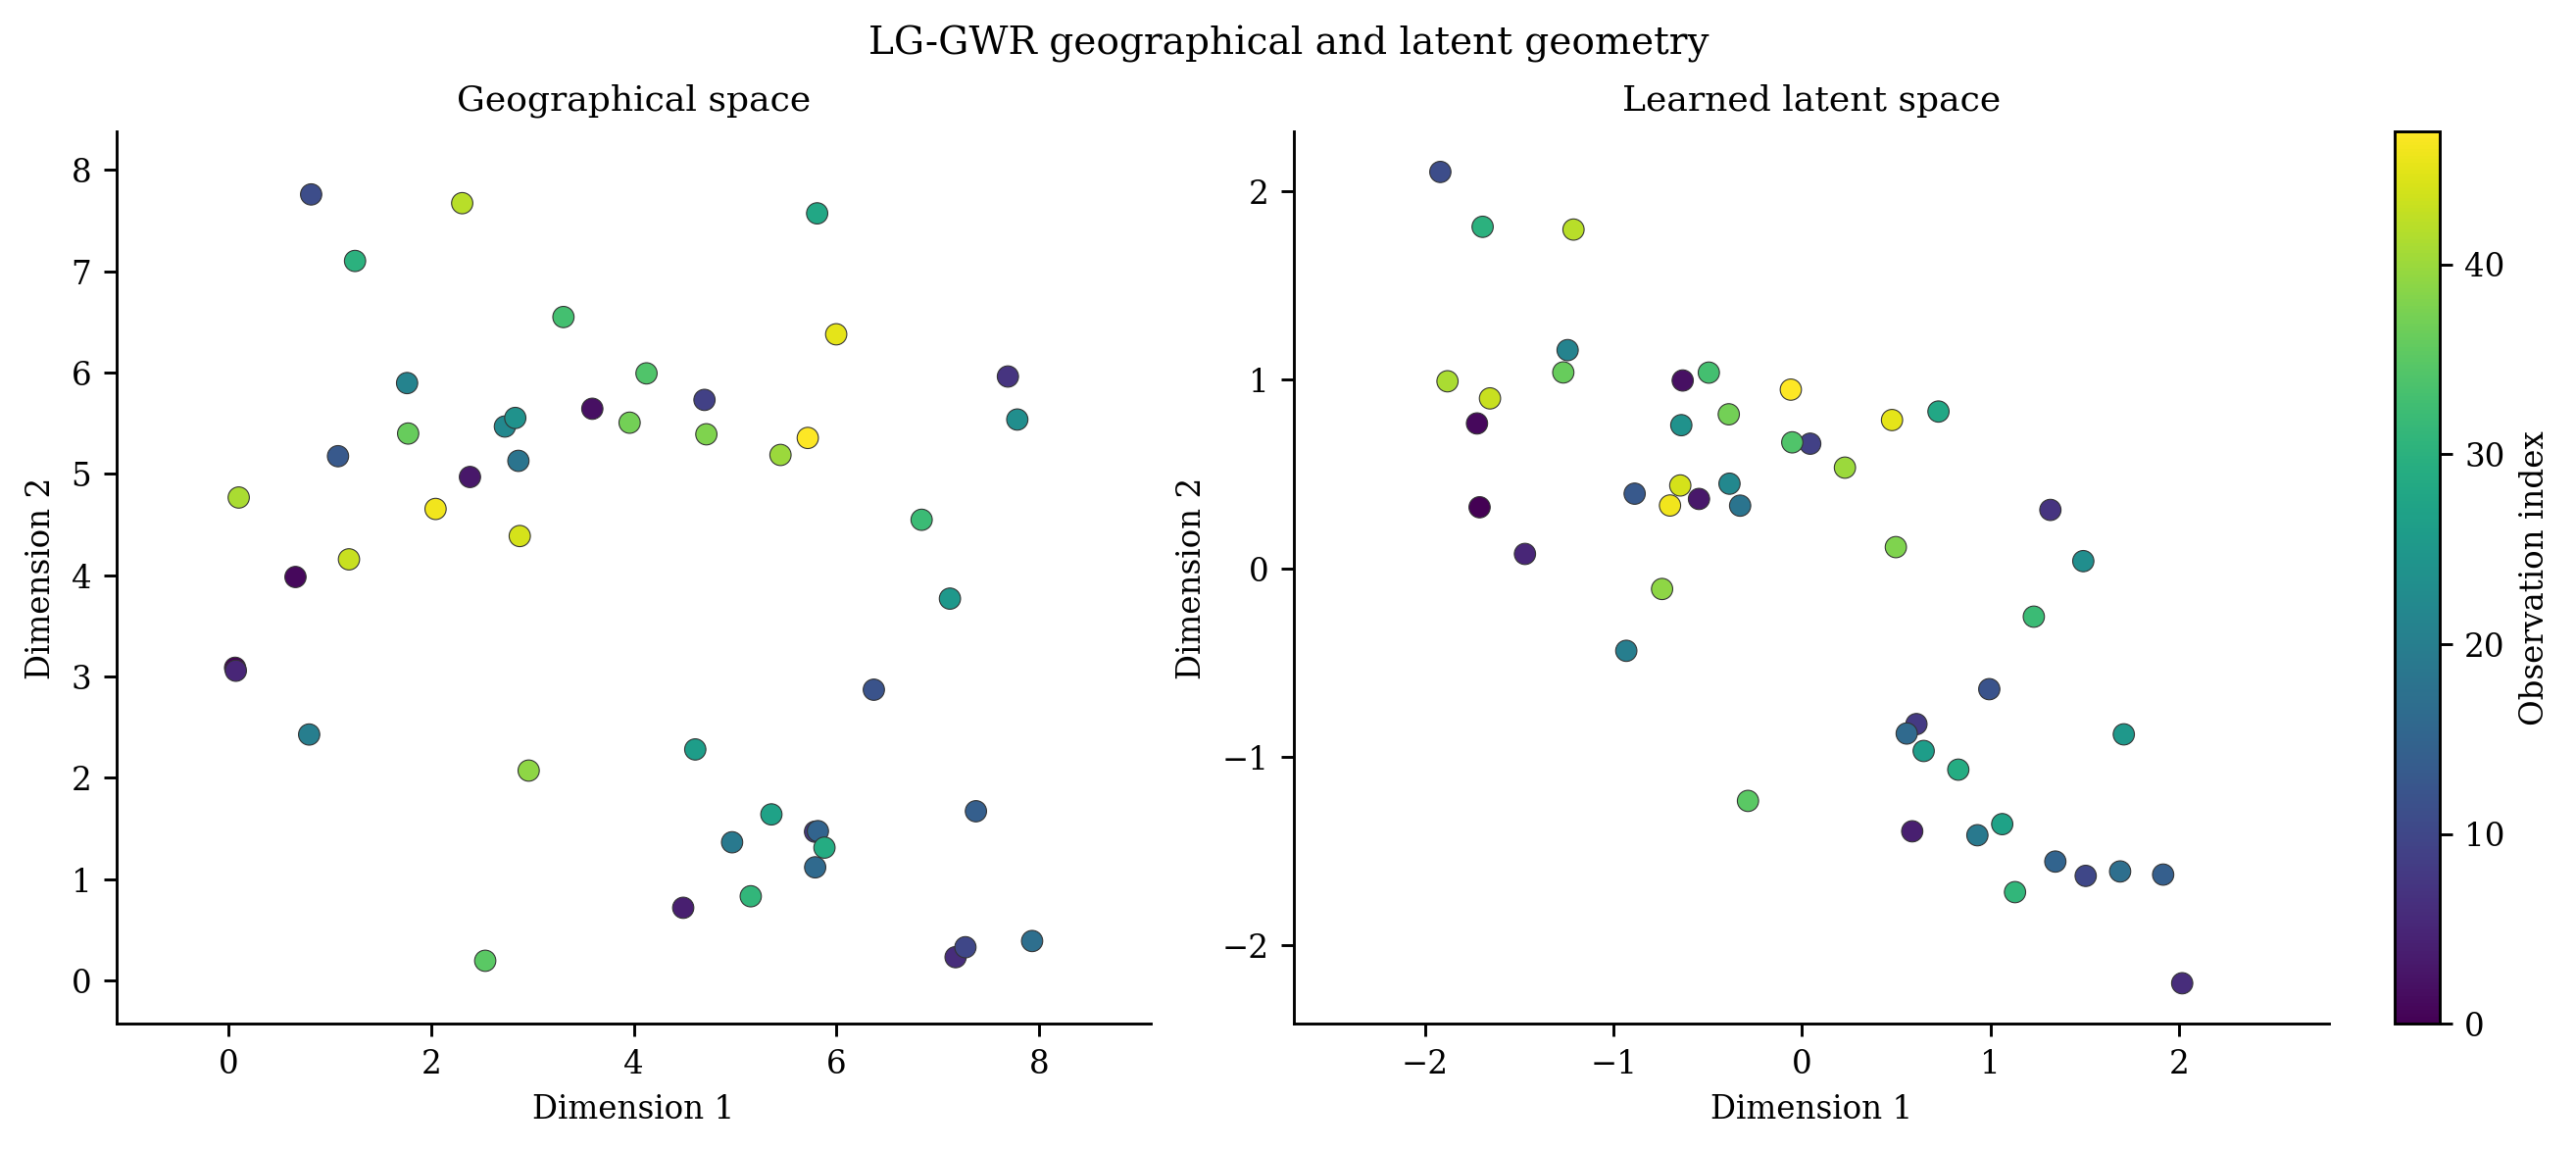
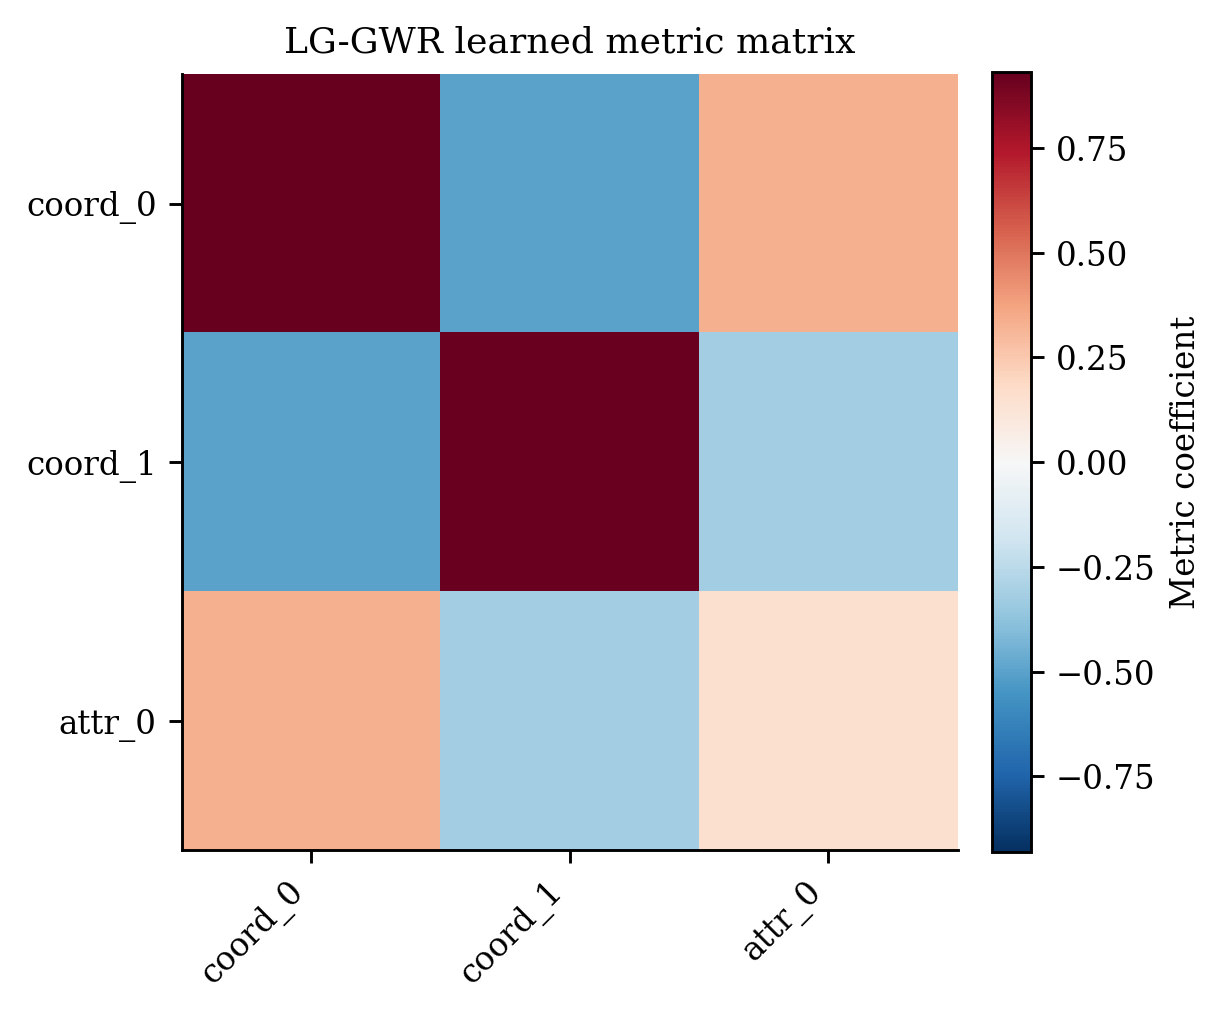
| How do latent geometry or regimes change structure? | LGGWR and GRGWR specialist plots |
Publication workflow
Use a projected coordinate system, consistent limits and colour scales across compared maps, explicit units, a significance/uncertainty layer, and vector output when possible.
Surfaces and array inputs
# SPDX-FileCopyrightText: 2026 Jinghao Hu
# SPDX-License-Identifier: MIT

"""Model-aware coefficient maps plus all historical array-based maps."""

import matplotlib

matplotlib.use("Agg", force=True)
import geopandas as gpd
import numpy as np
from shapely.geometry import Point
from pygwrx.plotting import (
    create_choropleth,
    plot_array_significance_map,
    plot_bandwidth,
    plot_coefficient_map,
    plot_coefficient_surface,
    plot_local_coefficients,
    plot_local_diagnostic_map,
    plot_local_r2,
    plot_model_significance_map,
    plot_multiple_coefficients,
    plot_significance_map,
)
from _common import save_plot
from _models import surface_models

X, y, coords, gwr, _, _ = surface_models()
coords_array = coords.to_numpy()
p_values = np.full_like(gwr.coef_, 0.02)
plots = {
    "coefficient_map.png": plot_coefficient_map(gwr, "x1", theme="paper"),
    "model_significance.png": plot_model_significance_map(gwr, "x1", correction="raw"),
    "dispatch_model_significance.png": plot_significance_map(gwr, "x1"),
    "local_diagnostic.png": plot_local_diagnostic_map(gwr, "local_r2"),
    "array_significance.png": plot_array_significance_map(
        coords_array, p_values, feature_idx=0, coefficients=gwr.coef_
    ),
    "dispatch_array_significance.png": plot_significance_map(
        coords_array, p_values, feature_idx=0, coefficients=gwr.coef_
    ),
    "local_coefficients.png": plot_local_coefficients(coords_array, gwr.coef_, 0, "x1"),
    "coefficient_surface.png": plot_coefficient_surface(
        coords_array, gwr.coef_, 0, interpolation="nearest"
    ),
    "array_local_r2.png": plot_local_r2(coords_array, gwr.local_r2_),
    "bandwidth_map.png": plot_bandwidth(
        coords_array, 2.0, sample_locations=coords_array[:3]
    ),
    "multiple_coefficients.png": plot_multiple_coefficients(
        coords_array, gwr.coef_, feature_names=["x1", "x2"], shared_scale=True
    ),
}
for name, result in plots.items():
    print(save_plot(result, name))
gdf = gpd.GeoDataFrame(
    {"value": gwr.coef_[:, 0]},
    geometry=[Point(x, y) for x, y in coords_array],
    crs="EPSG:3857",
)
print(save_plot(create_choropleth(gdf, "value"), "choropleth.png"))
Diagnostics and comparison
# SPDX-FileCopyrightText: 2026 Jinghao Hu
# SPDX-License-Identifier: MIT

"""All general residual, bandwidth, comparison, and collinearity plots."""

import matplotlib

matplotlib.use("Agg", force=True)
from pygwrx.plotting import (
    compare_coefficient_surfaces,
    compare_model_diagnostics,
    plot_bandwidth_selection,
    plot_coefficient_variability,
    plot_diagnostic_panel,
    plot_kernel_weights,
    plot_local_collinearity,
    plot_local_diagnostics,
    plot_mgwr_bandwidths,
    plot_observed_vs_predicted,
    plot_qq,
    plot_residual_histogram,
    plot_residuals,
    plot_spatial_residuals,
)
from _common import save_plot
from _models import surface_models

X, y, coords, gwr, mgwr, lcr = surface_models()
plots = {
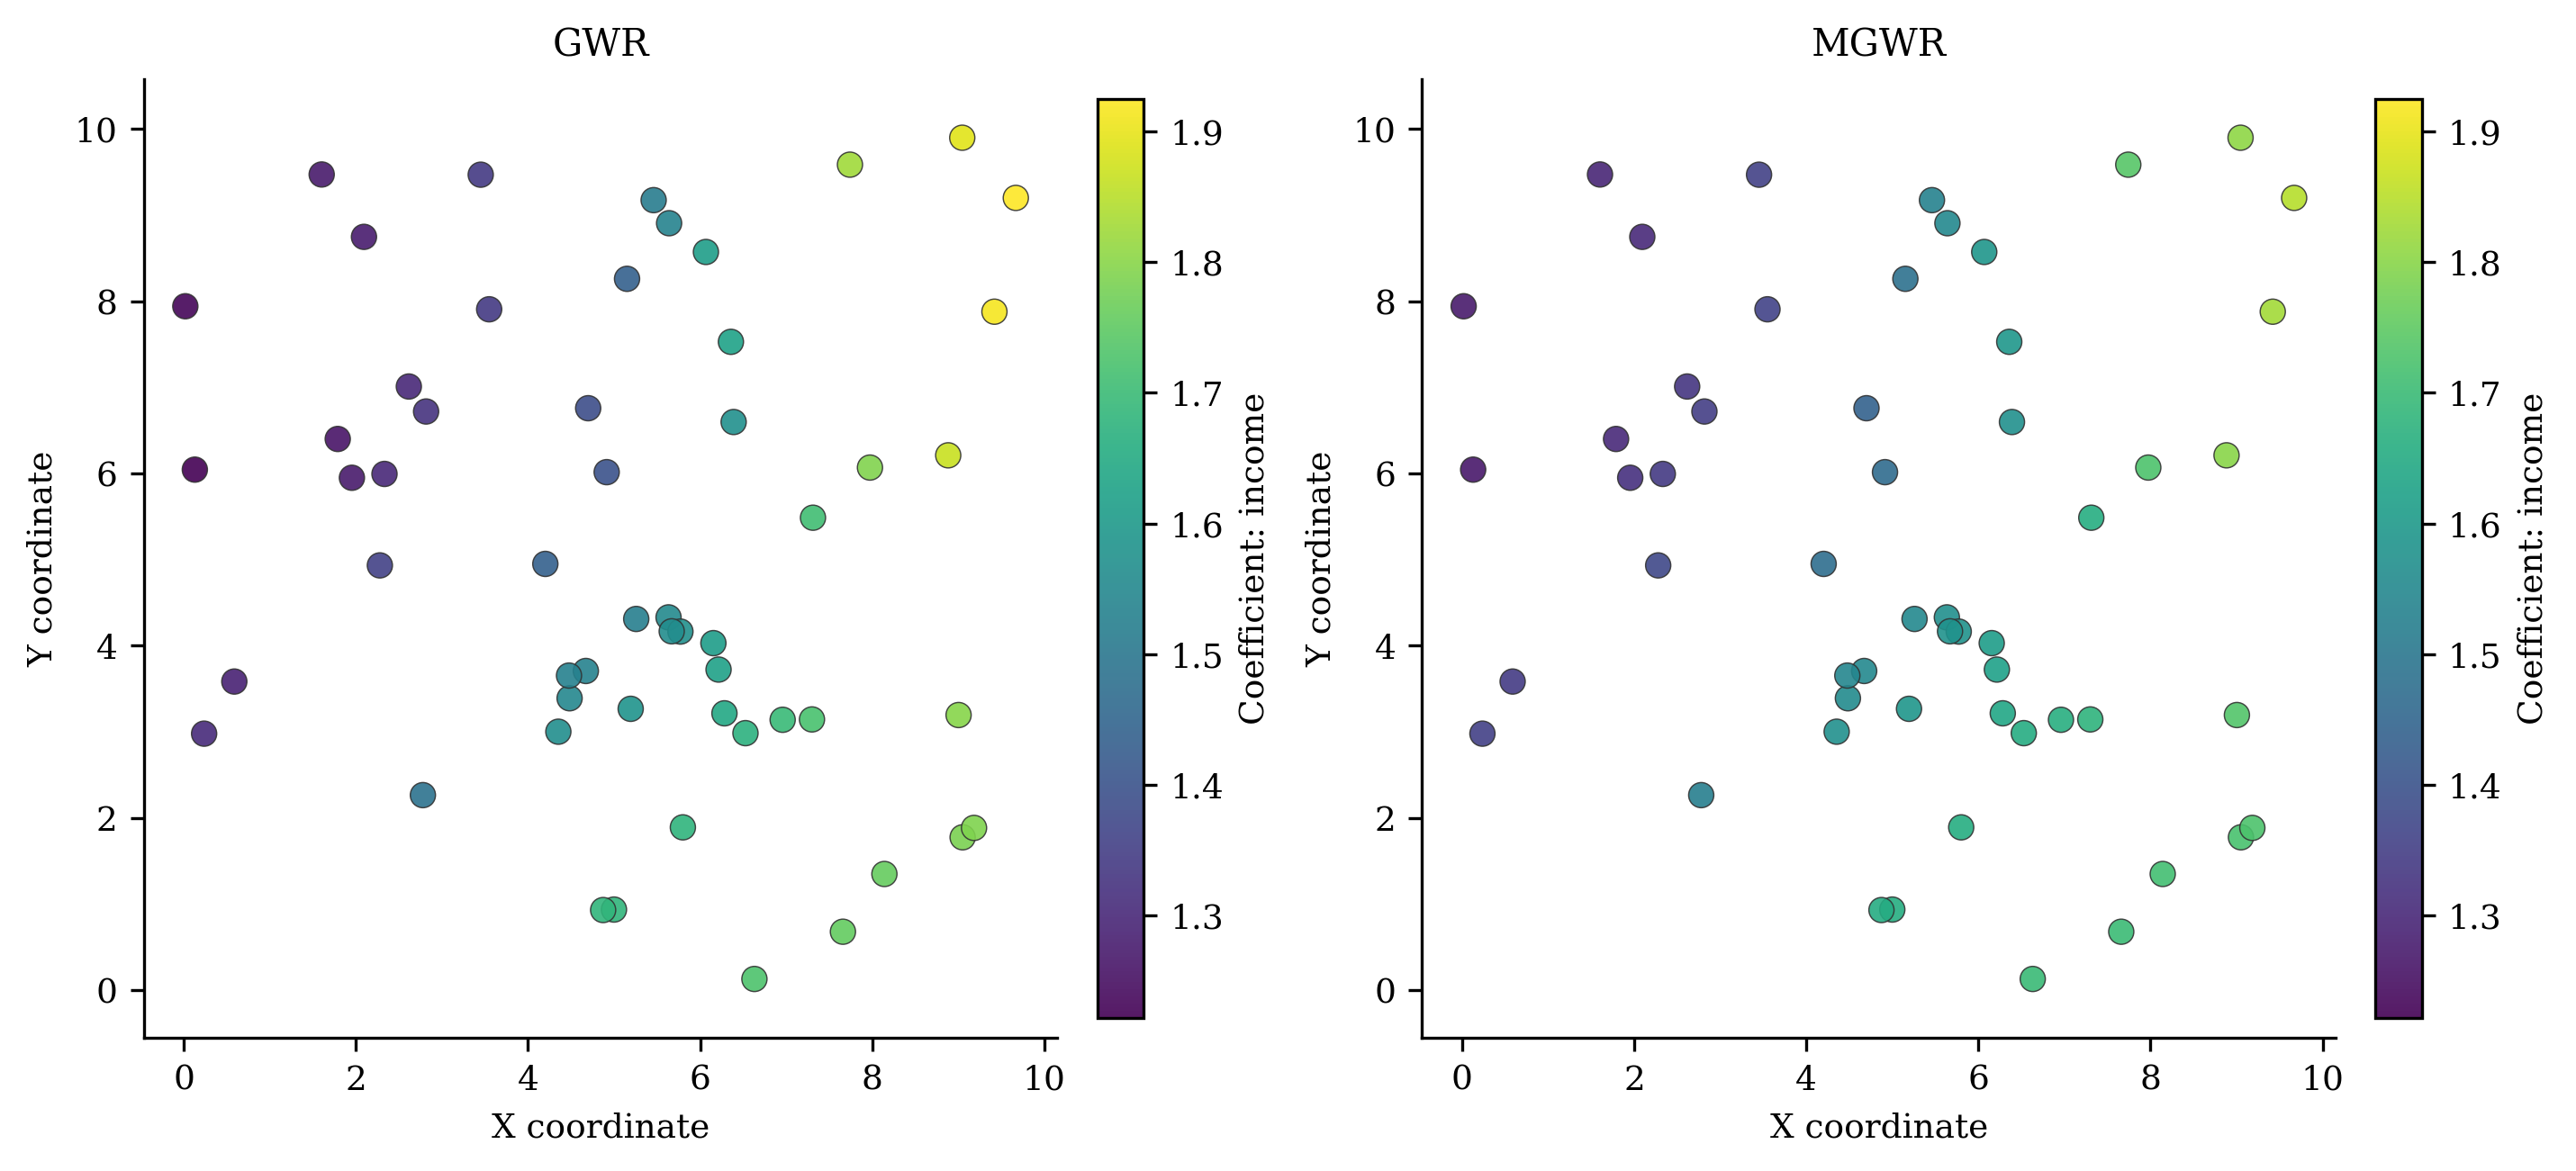
    "compare_surfaces.png": compare_coefficient_surfaces([gwr, mgwr], "x1"),
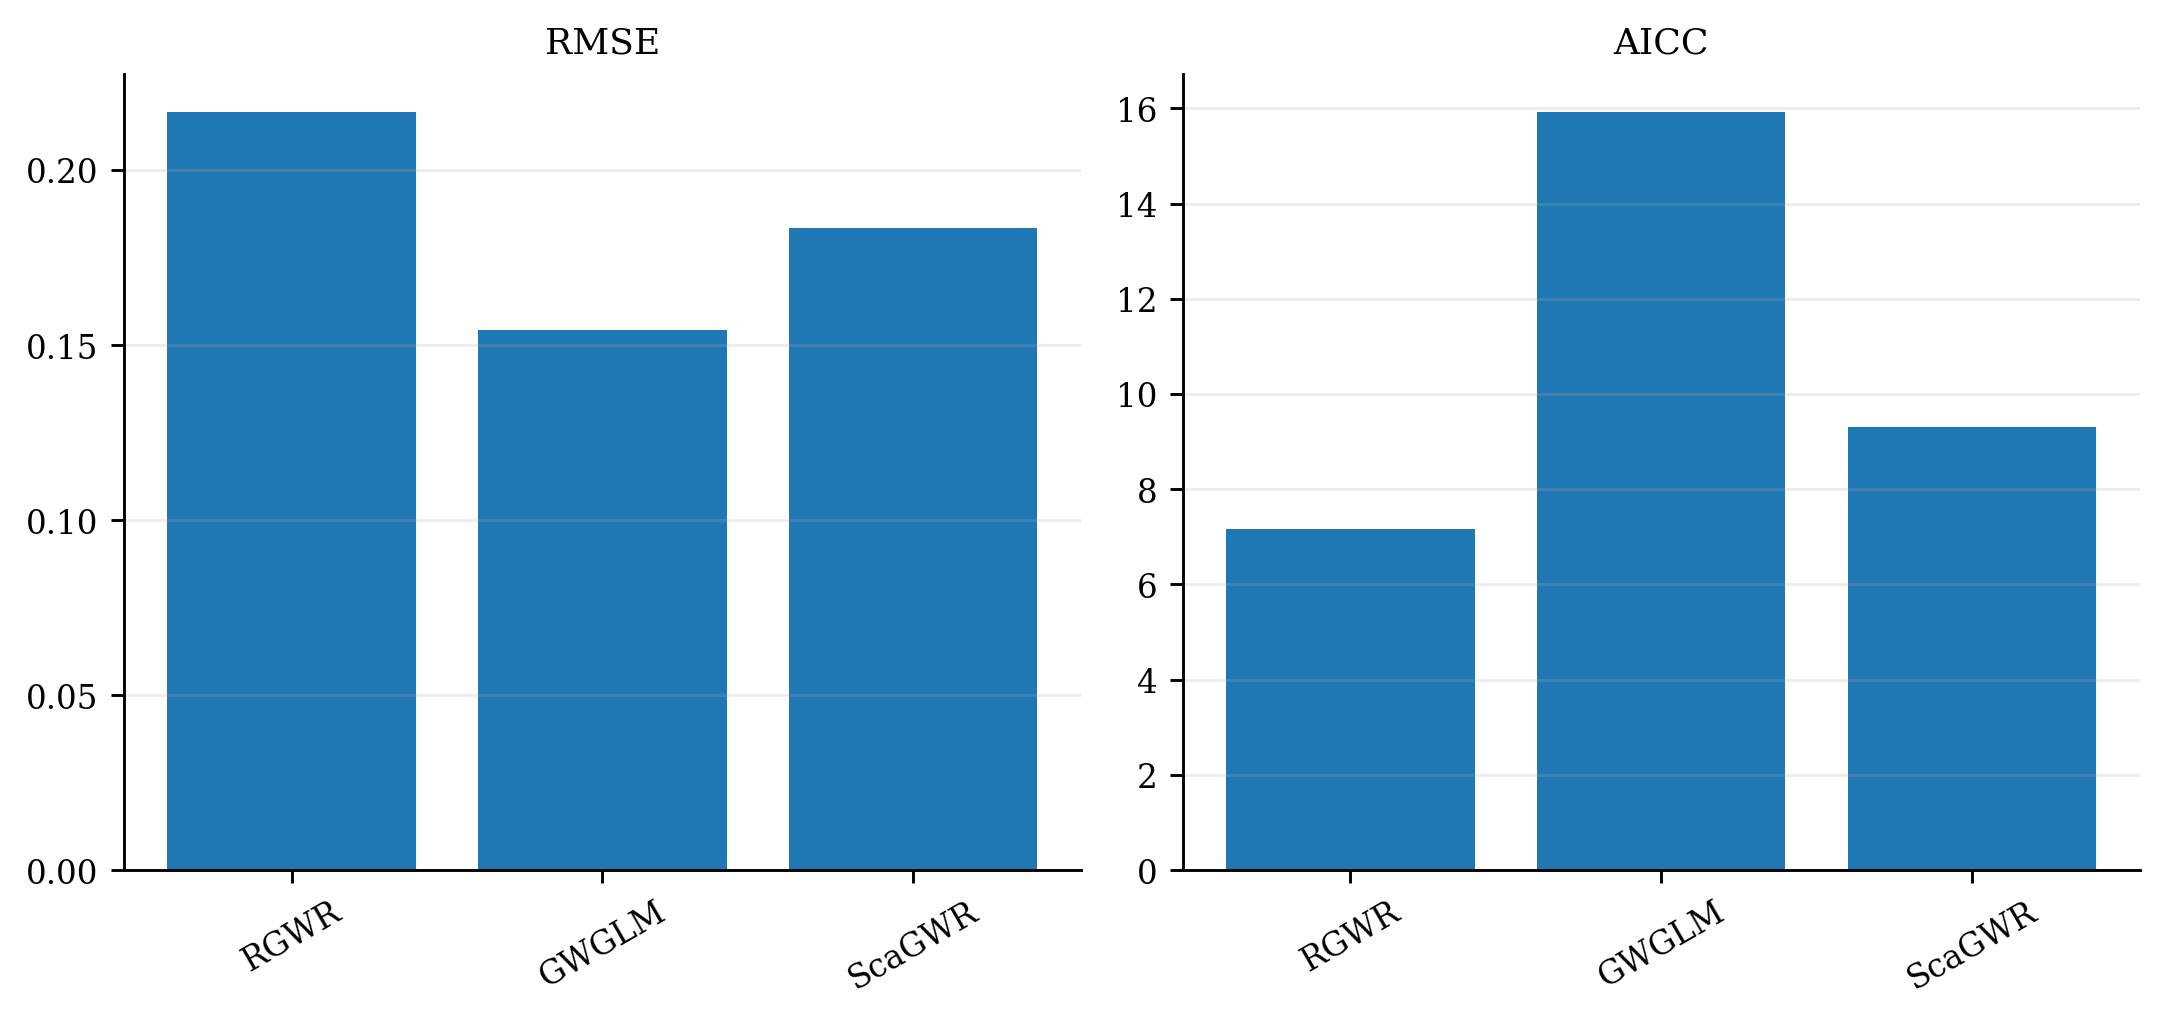
    "compare_diagnostics.png": compare_model_diagnostics([gwr, mgwr]),
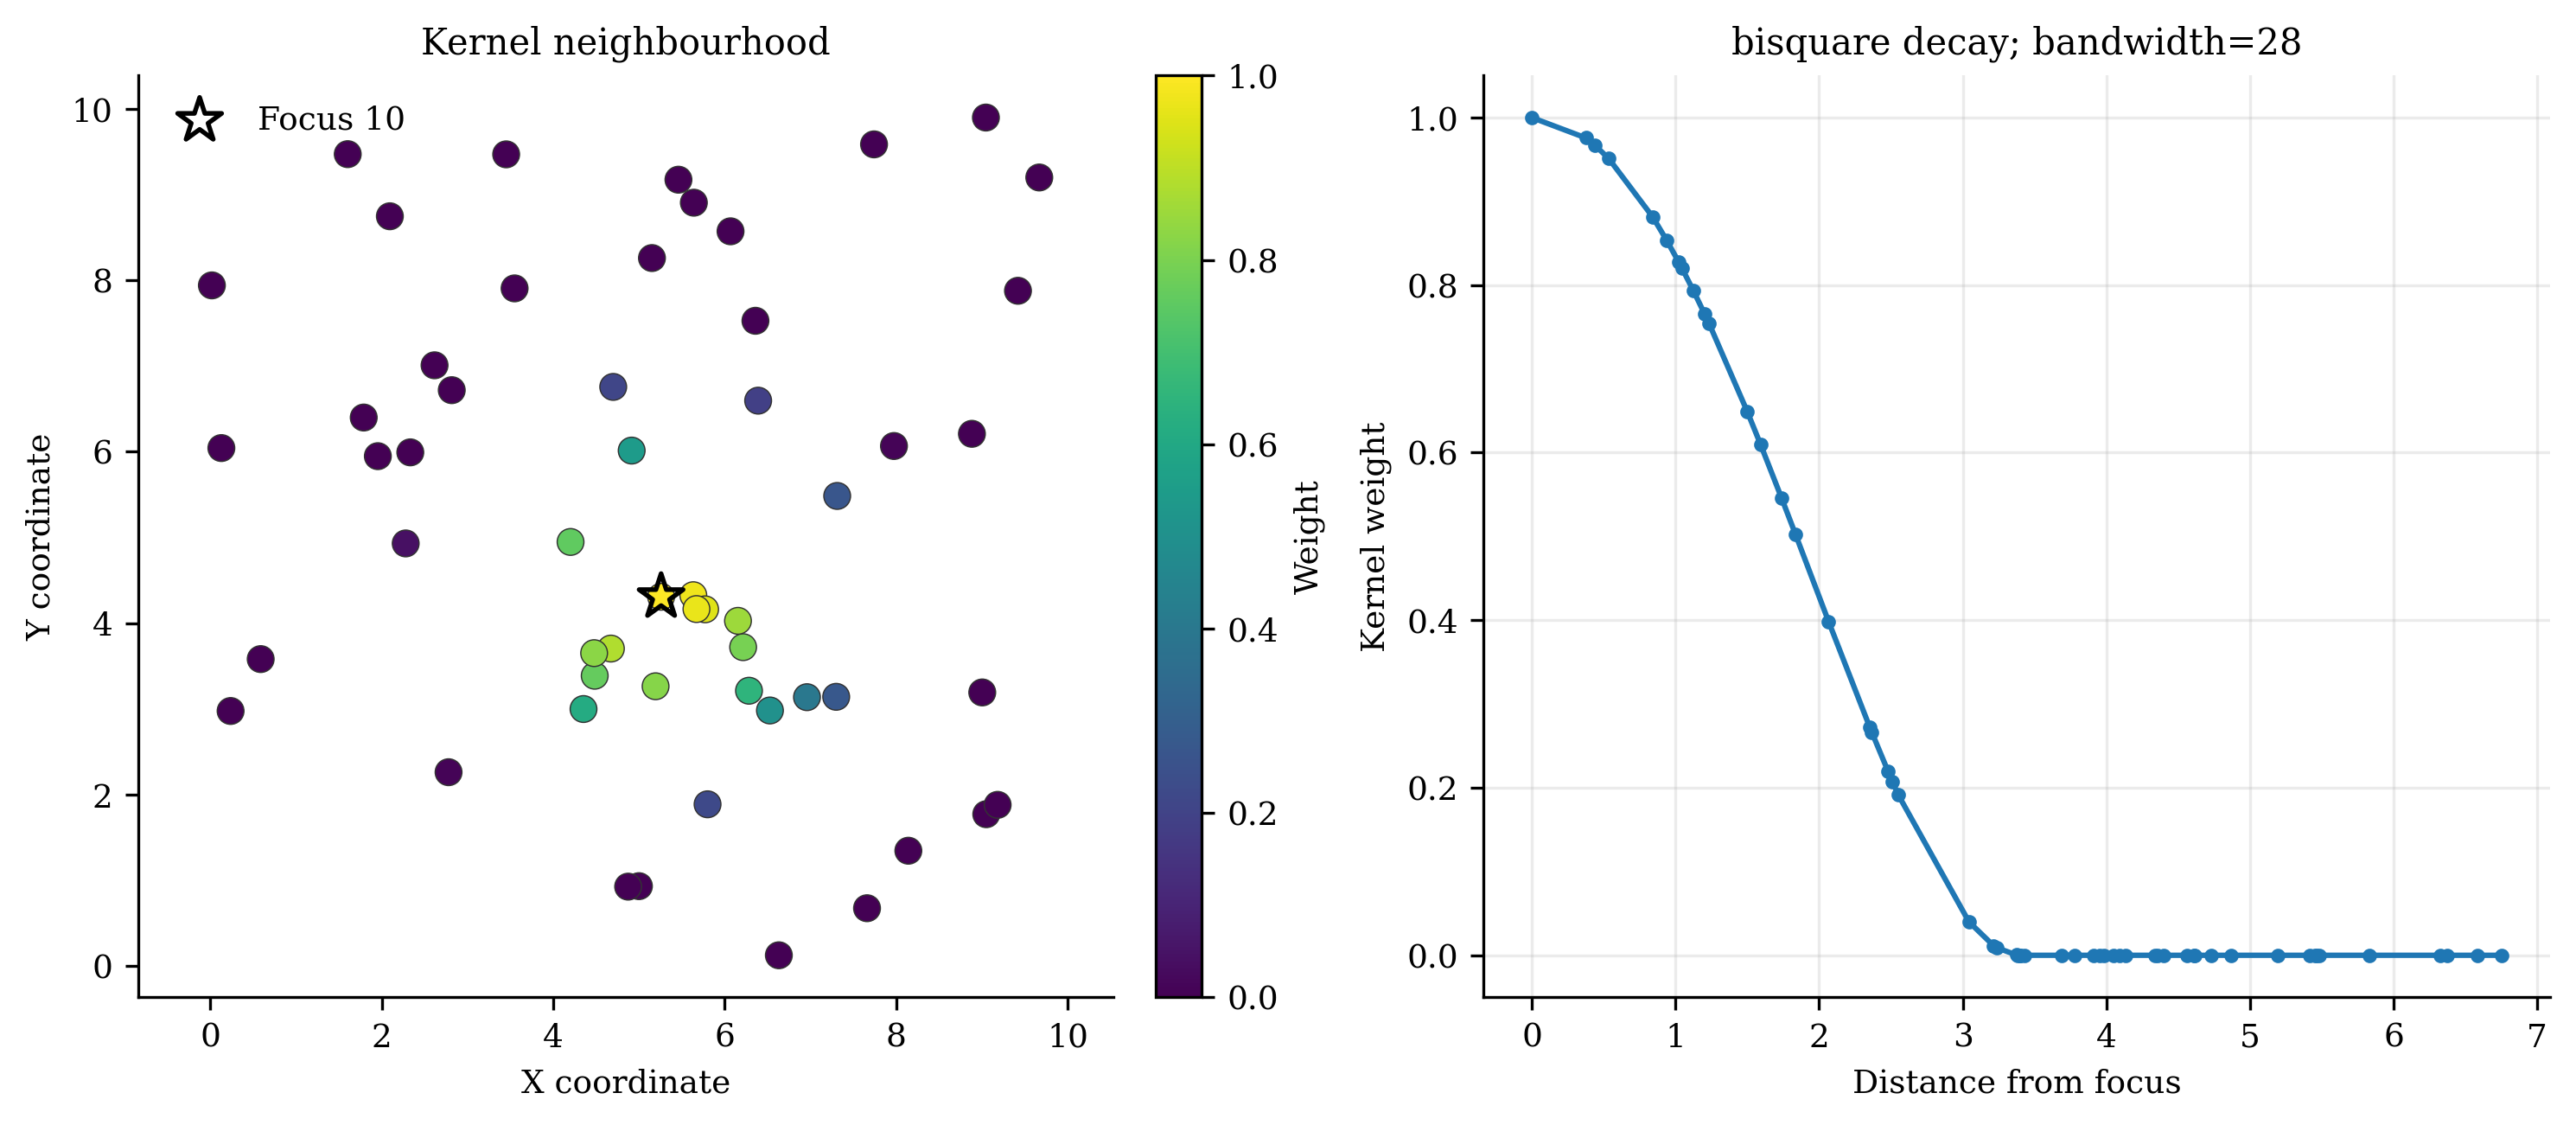
    "kernel_weights.png": plot_kernel_weights(gwr, focus=3),
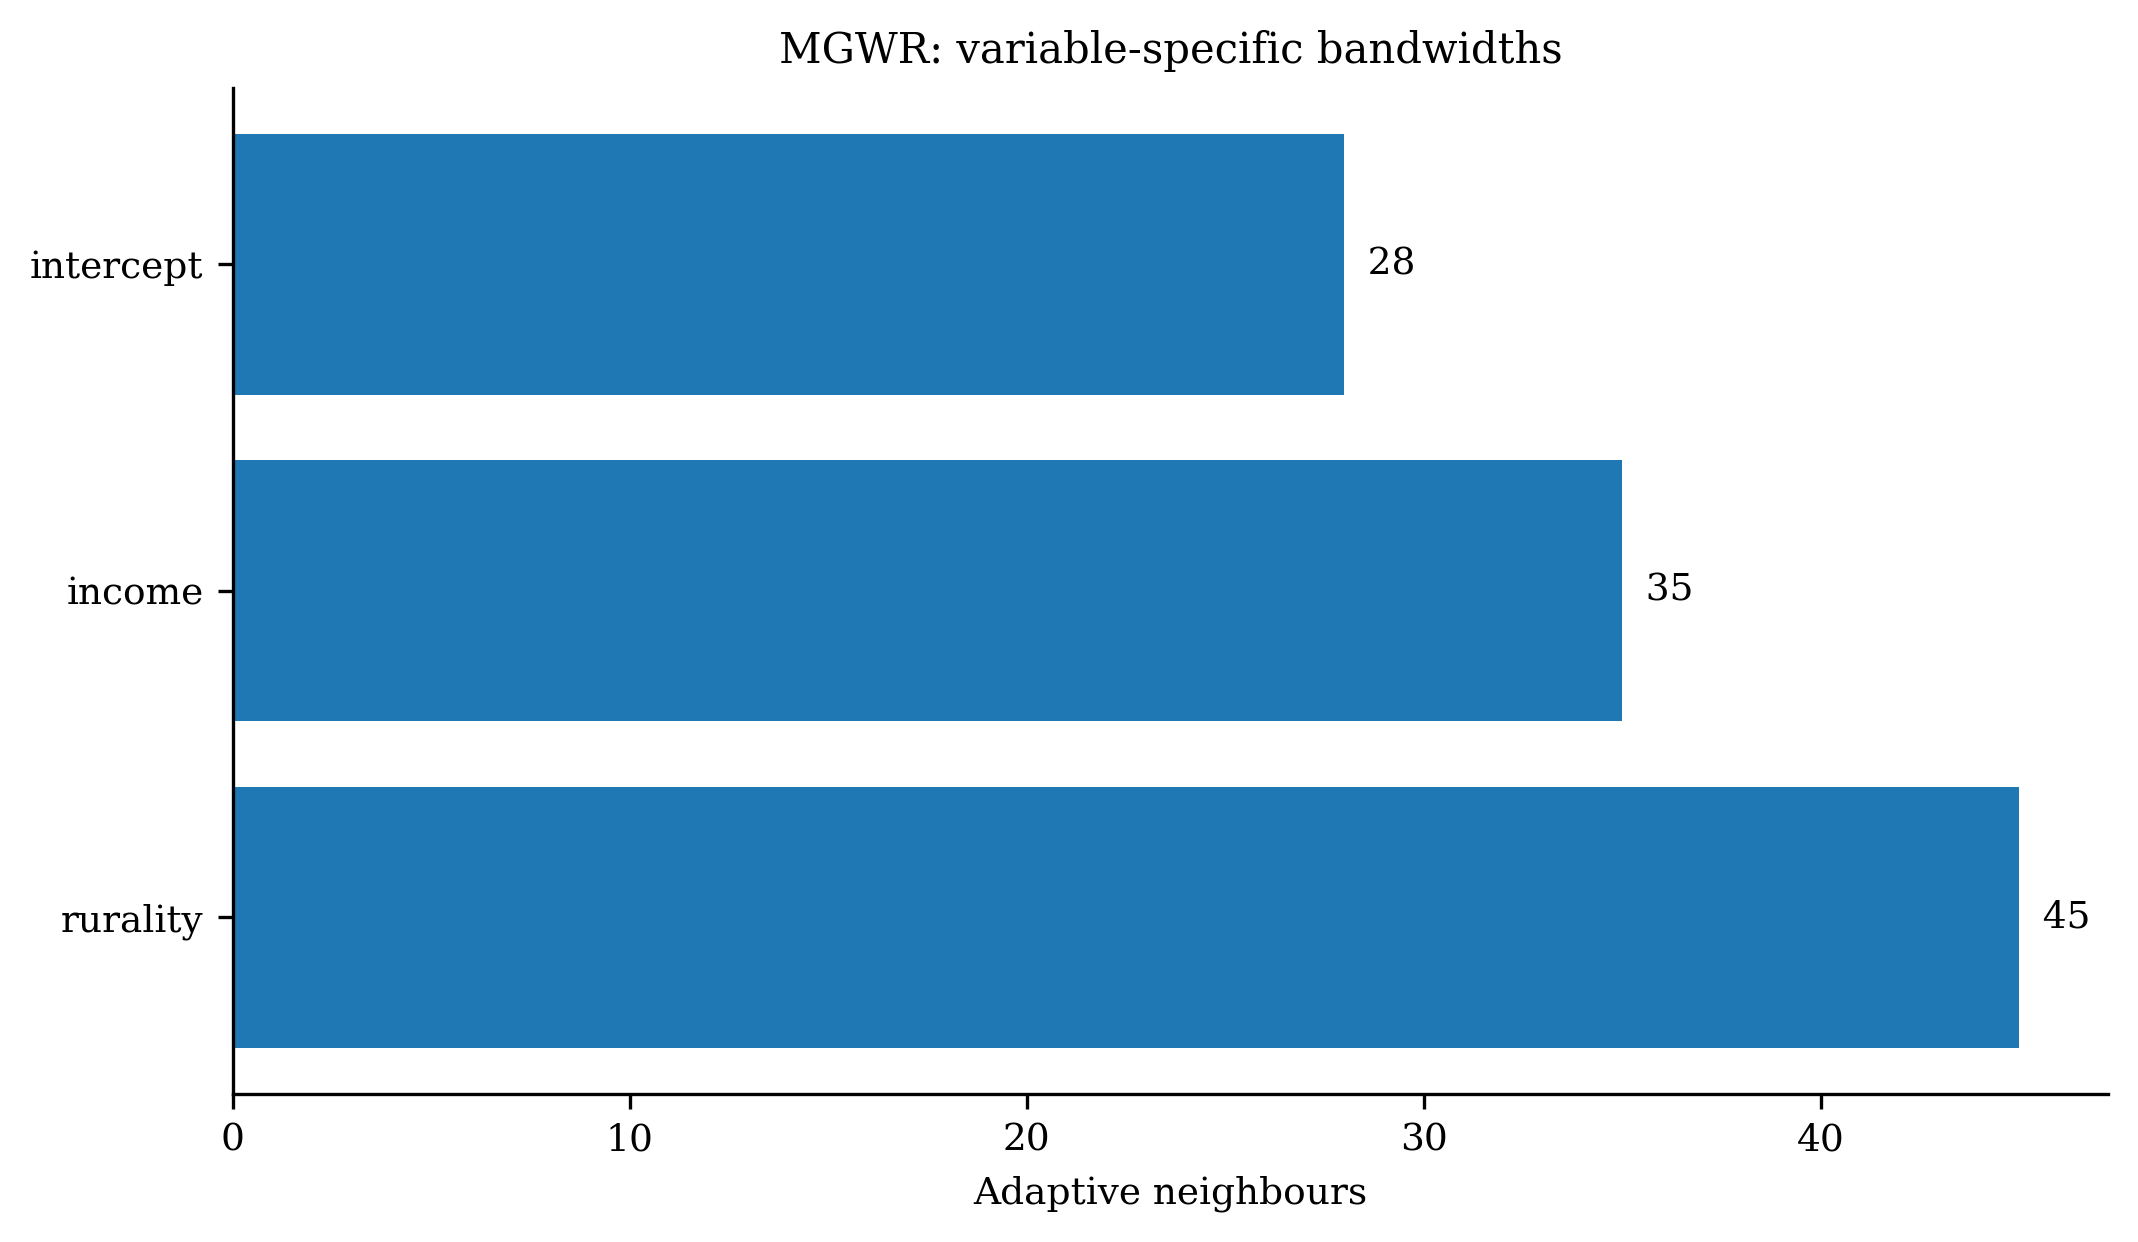
    "mgwr_bandwidths.png": plot_mgwr_bandwidths(mgwr),
    "residuals.png": plot_residuals(gwr.fitted_values_, gwr.residuals_),
    "residual_histogram.png": plot_residual_histogram(gwr.residuals_),
    "qq.png": plot_qq(gwr.residuals_),
    "spatial_residuals.png": plot_spatial_residuals(coords, gwr.residuals_),
    "observed_predicted.png": plot_observed_vs_predicted(y, gwr.fitted_values_),
    "bandwidth_selection.png": plot_bandwidth_selection(
        [10, 15, 20, 25], [14.0, 9.0, 7.5, 8.2], 20, criterion="AICc"
    ),
    "coefficient_variability.png": plot_coefficient_variability(
        gwr.coef_, feature_names=["x1", "x2"]
    ),
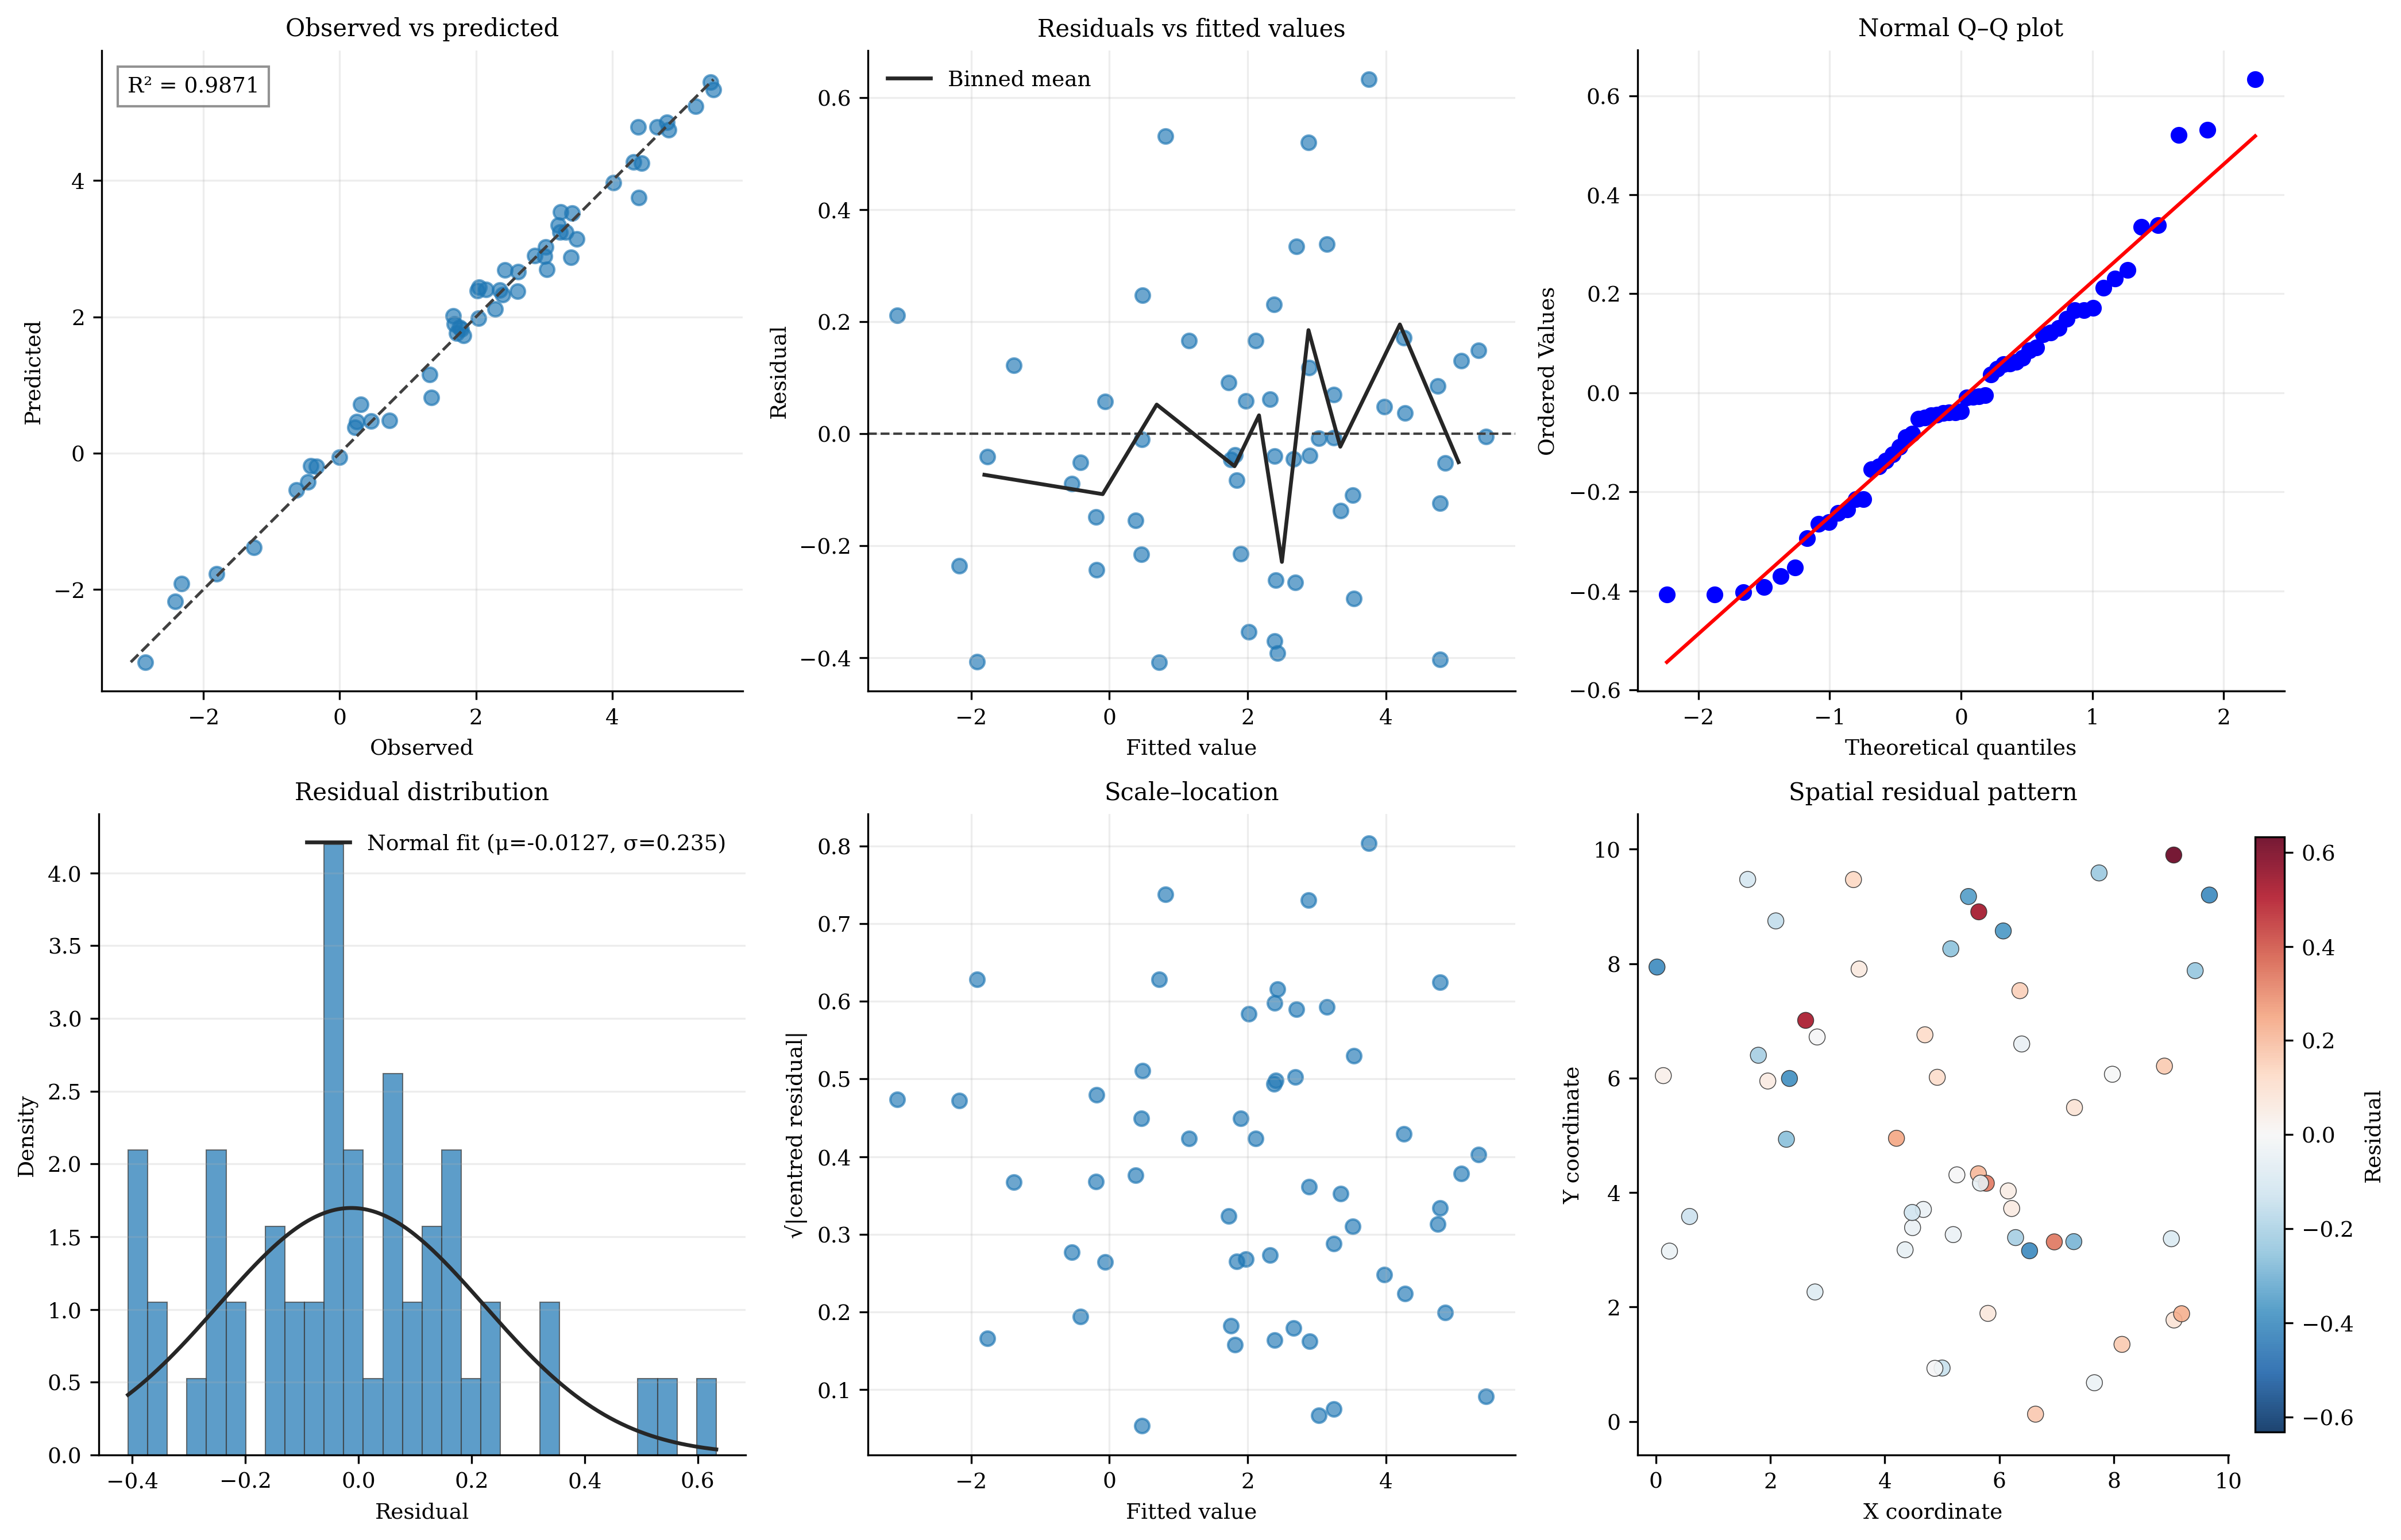
    "diagnostic_panel_arrays.png": plot_diagnostic_panel(
        y, gwr.fitted_values_, gwr.residuals_, coords
    ),
    "diagnostic_panel_model.png": plot_diagnostic_panel(gwr),
    "local_diagnostics.png": plot_local_diagnostics(
        coords, {"local_r2": gwr.local_r2_, "influence": gwr.influence_}
    ),
    "collinearity_gwr.png": plot_local_collinearity(gwr, "condition_number"),
    "collinearity_lcr.png": plot_local_collinearity(lcr, "local_lambda"),
}
for name, result in plots.items():
    print(save_plot(result, name))
Robust, regularized, and bootstrap models
# SPDX-FileCopyrightText: 2026 Jinghao Hu
# SPDX-License-Identifier: MIT

"""All robust, GLM, Lasso, mixed, bootstrap, and scalable plots."""

import matplotlib

matplotlib.use("Agg", force=True)
from pygwrx.plotting import (
    plot_bootstrap_bandwidths,
    plot_bootstrap_pvalues,
    plot_gwglm_residuals,
    plot_gwlasso_active_map,
    plot_gwlasso_alpha,
    plot_gwlasso_selection_frequency,
    plot_mixed_gwr_coefficients,
    plot_rgwr_convergence,
    plot_rgwr_weights,
    plot_scalable_gwr_kernel,
)
from _common import save_plot
from _models import regularized_models

X, y, coords, rgwr, gwglm, gwlasso, mixed, bootstrap, scalable = regularized_models()
plots = {
    "rgwr_weights.png": plot_rgwr_weights(rgwr),
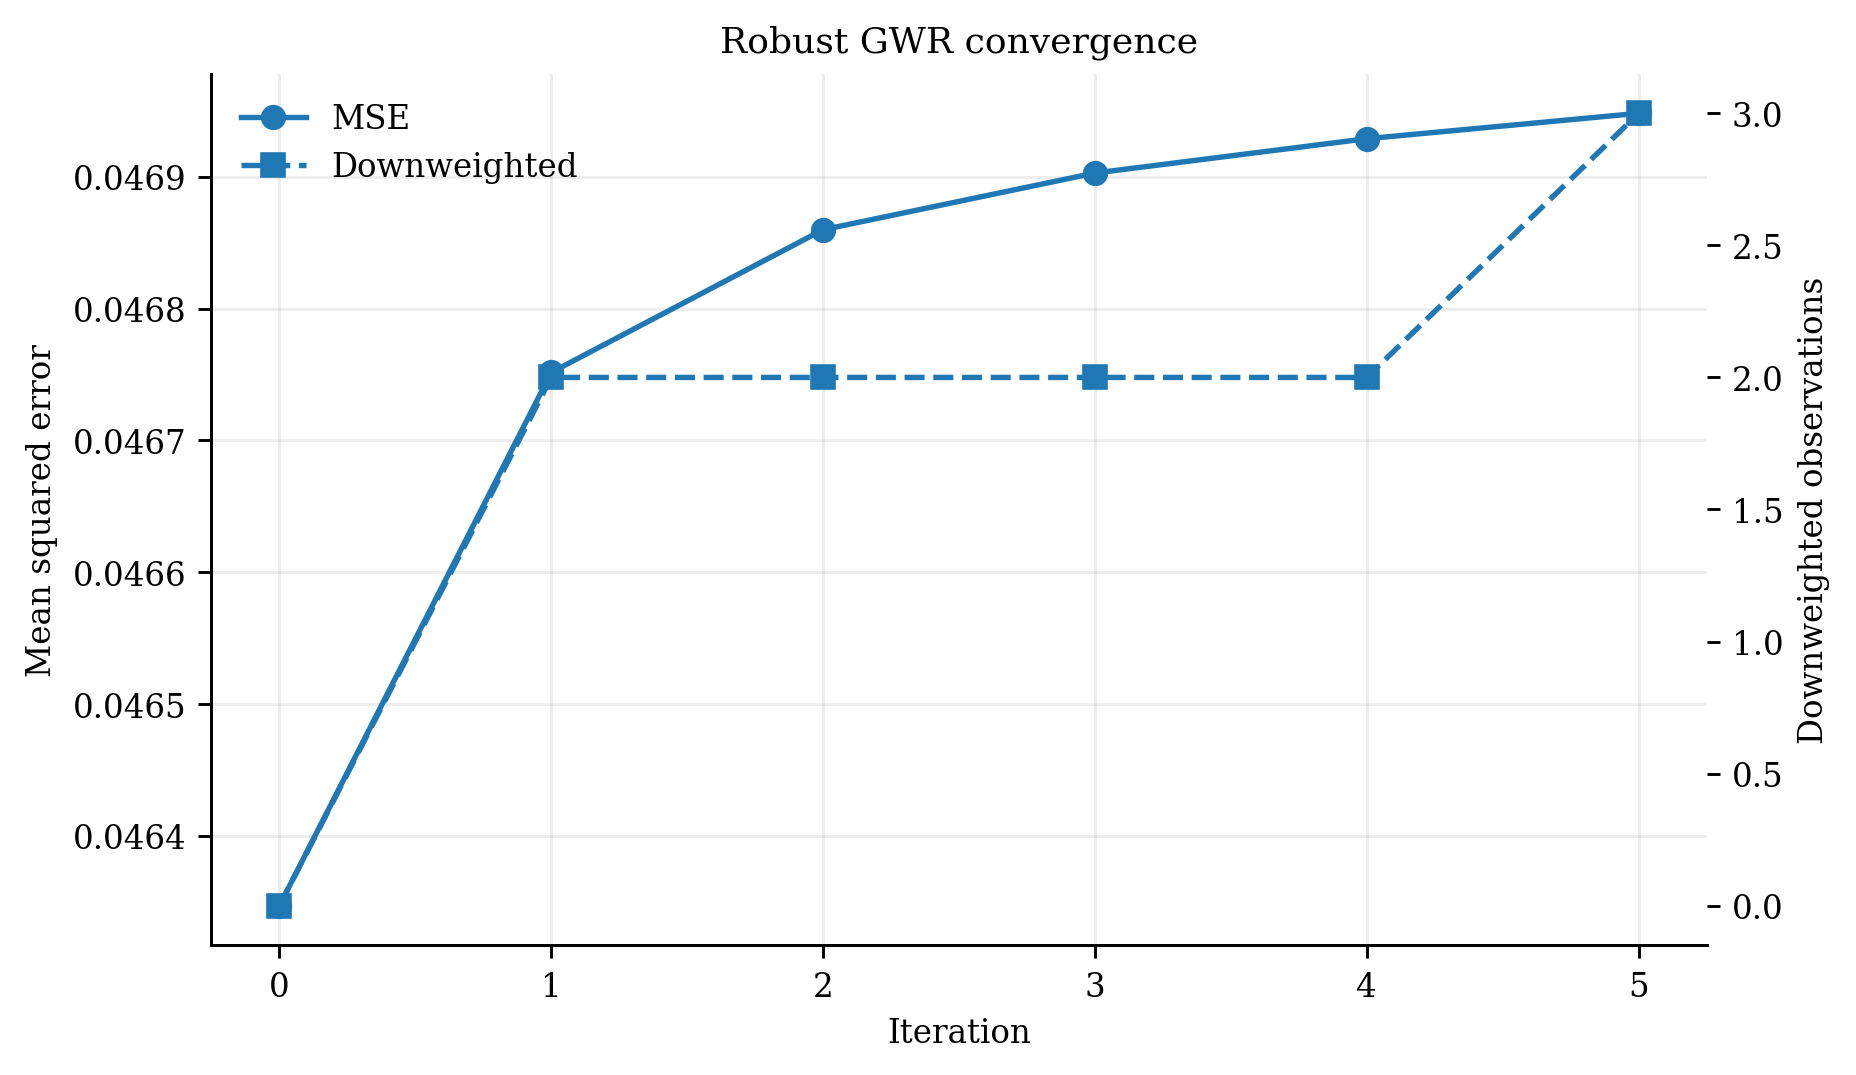
    "rgwr_convergence.png": plot_rgwr_convergence(rgwr),
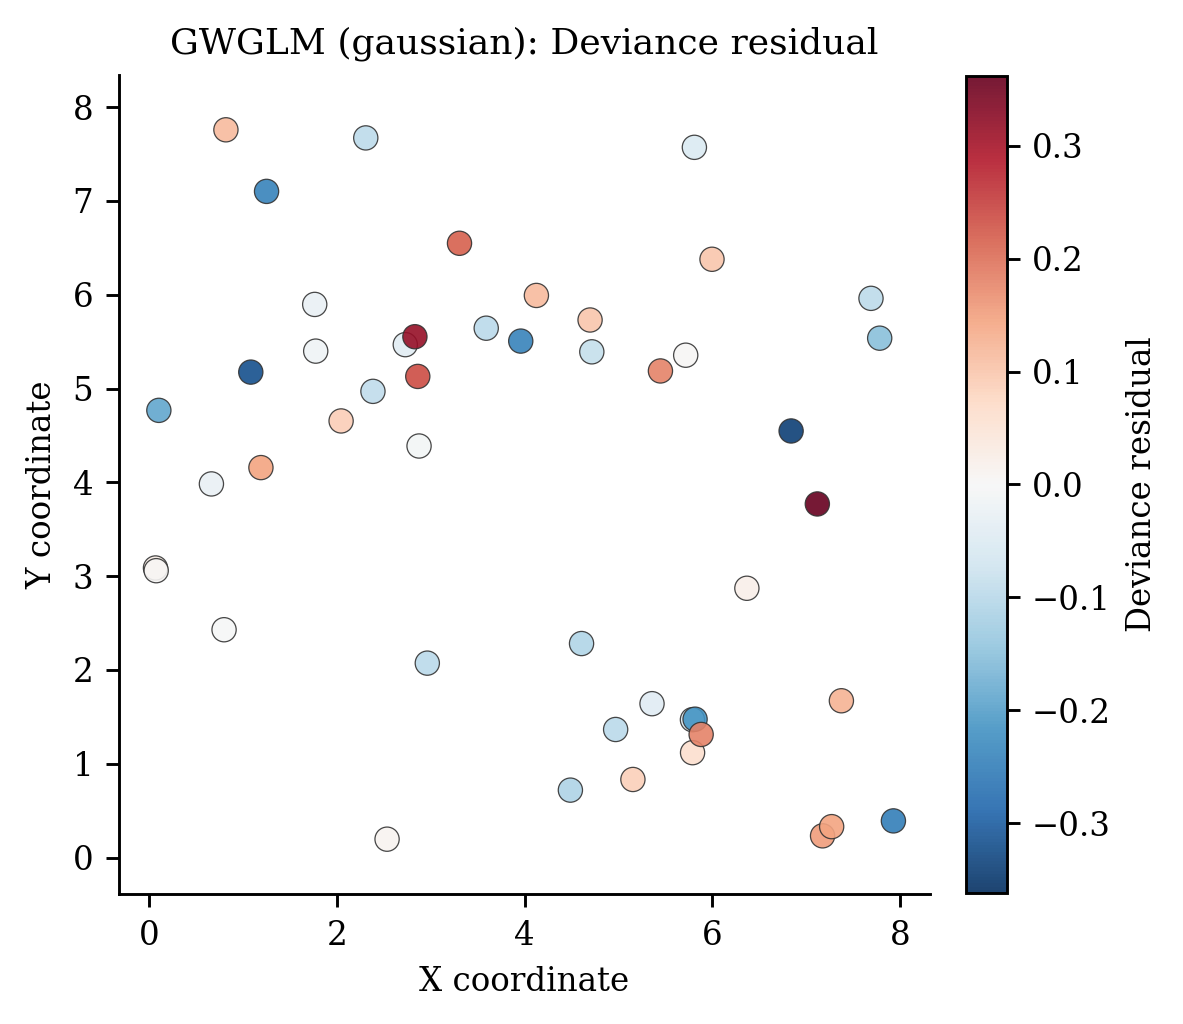
    "gwglm_residuals.png": plot_gwglm_residuals(gwglm),
    "gwlasso_frequency.png": plot_gwlasso_selection_frequency(gwlasso),
    "gwlasso_active.png": plot_gwlasso_active_map(gwlasso, "x1"),
    "gwlasso_alpha.png": plot_gwlasso_alpha(gwlasso),
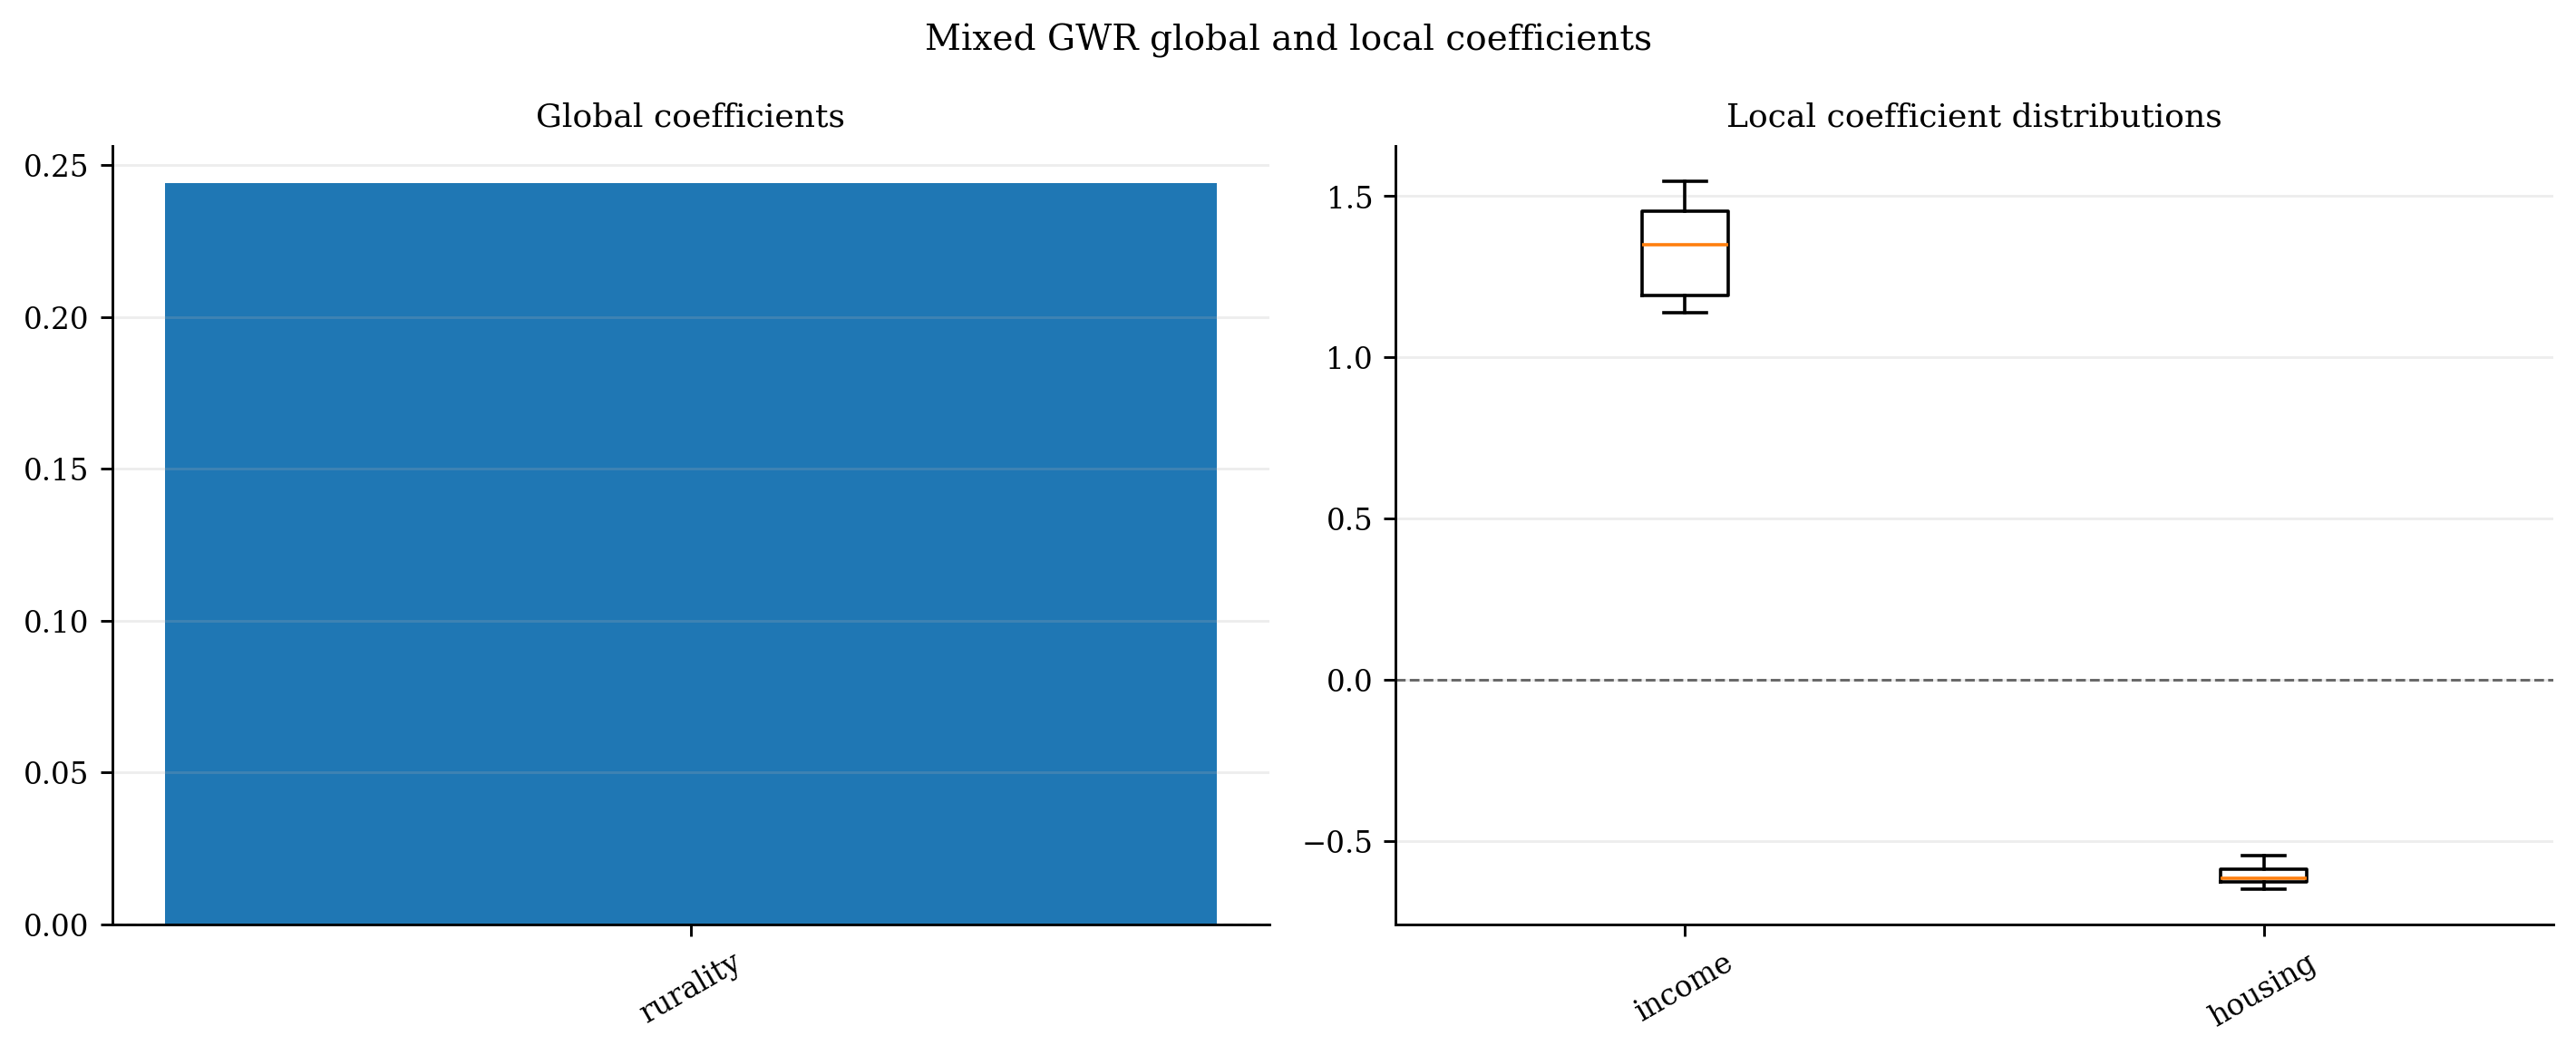
    "mixed_coefficients.png": plot_mixed_gwr_coefficients(mixed),
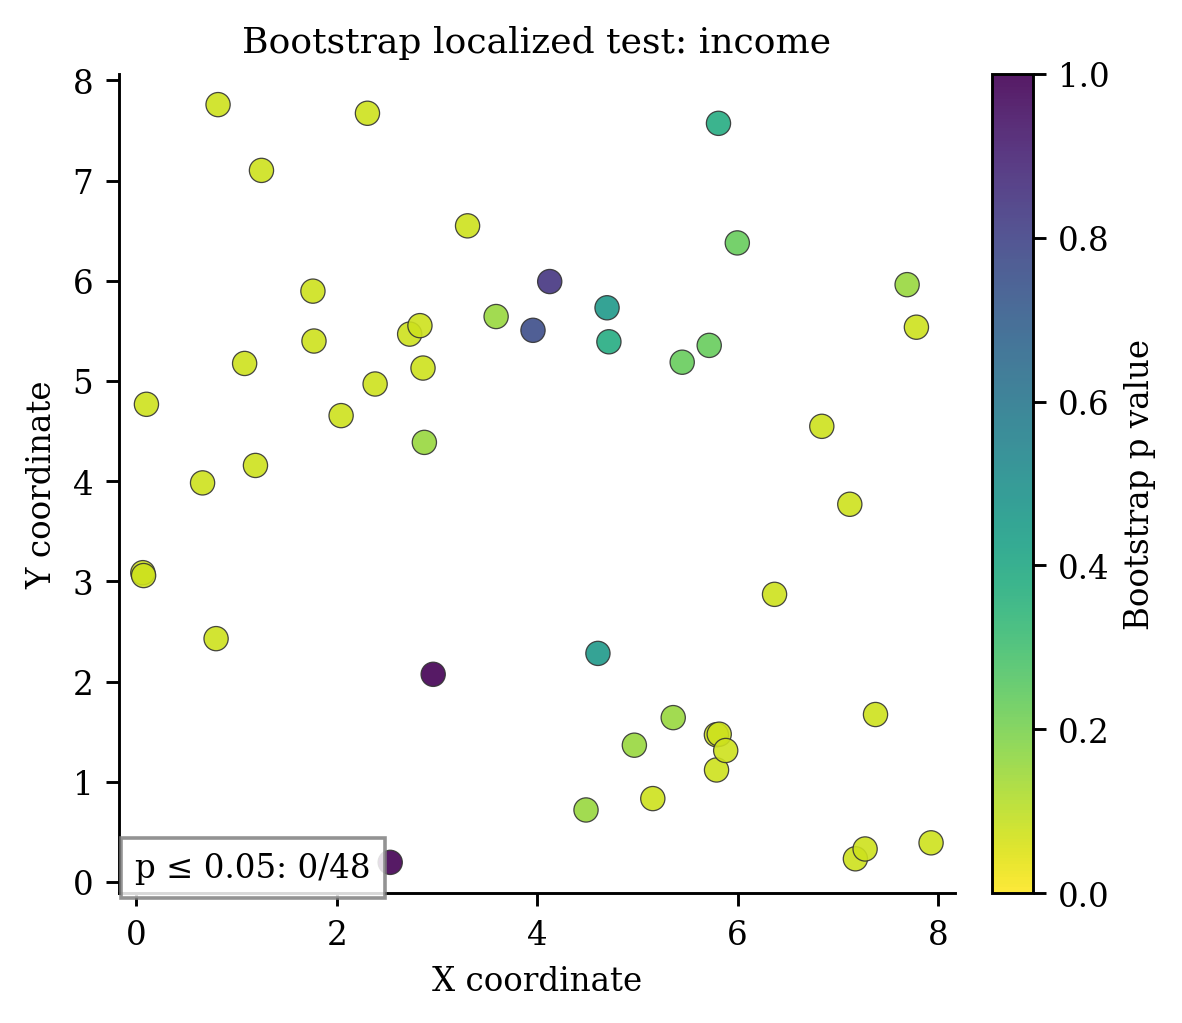
    "bootstrap_pvalues.png": plot_bootstrap_pvalues(bootstrap, "x1"),
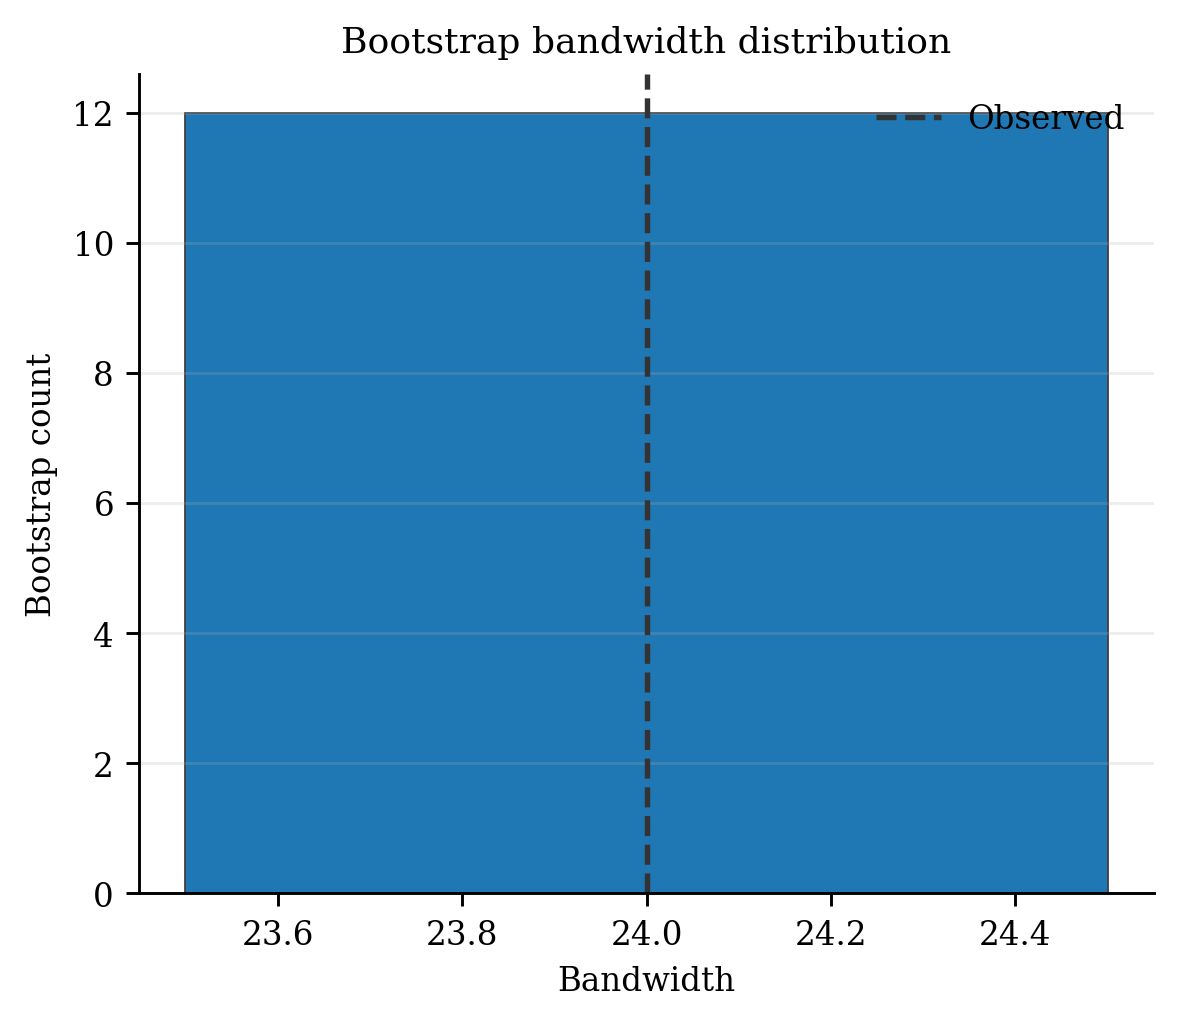
    "bootstrap_bandwidths.png": plot_bootstrap_bandwidths(bootstrap),
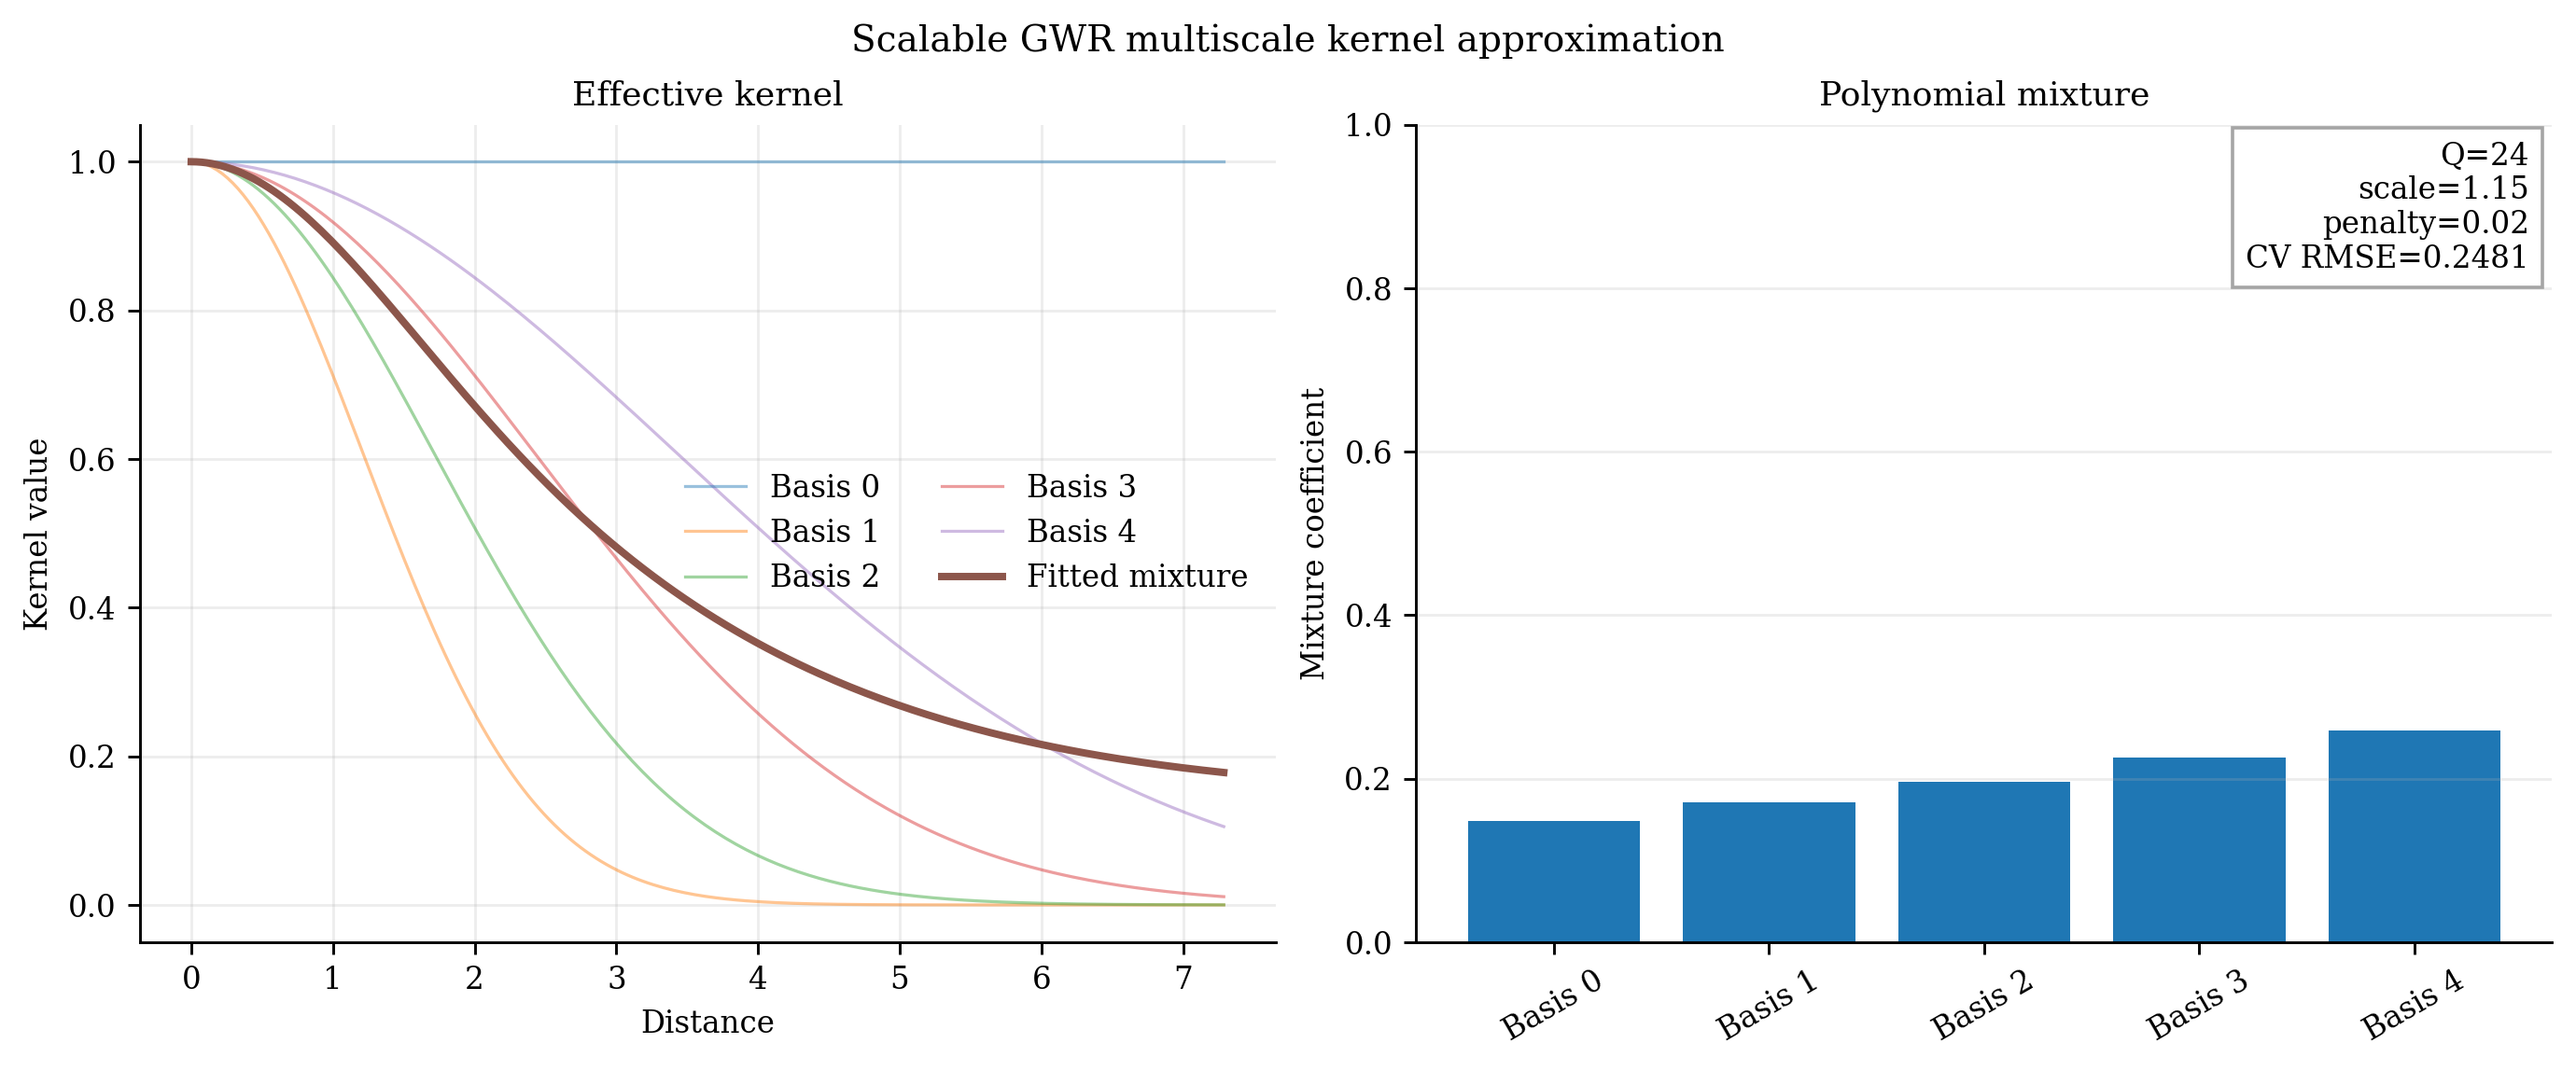
    "scalable_kernel.png": plot_scalable_gwr_kernel(scalable),
}
for name, result in plots.items():
    print(save_plot(result, name))
Multivariate and classification models
# SPDX-FileCopyrightText: 2026 Jinghao Hu
# SPDX-License-Identifier: MIT

"""All GWSS, GWPCA, and GWDA visualization functions."""

import matplotlib

matplotlib.use("Agg", force=True)
from pygwrx.plotting import (
    plot_gwda_classification,
    plot_gwda_confusion_matrix,
    plot_gwpca_explained_variance,
    plot_gwpca_loading,
    plot_gwss_statistic,
)
from _common import save_plot
from _models import multivariate_models

X, coords, gwss, gwpca, Xc, yc, cc, gwda = multivariate_models()
plots = {
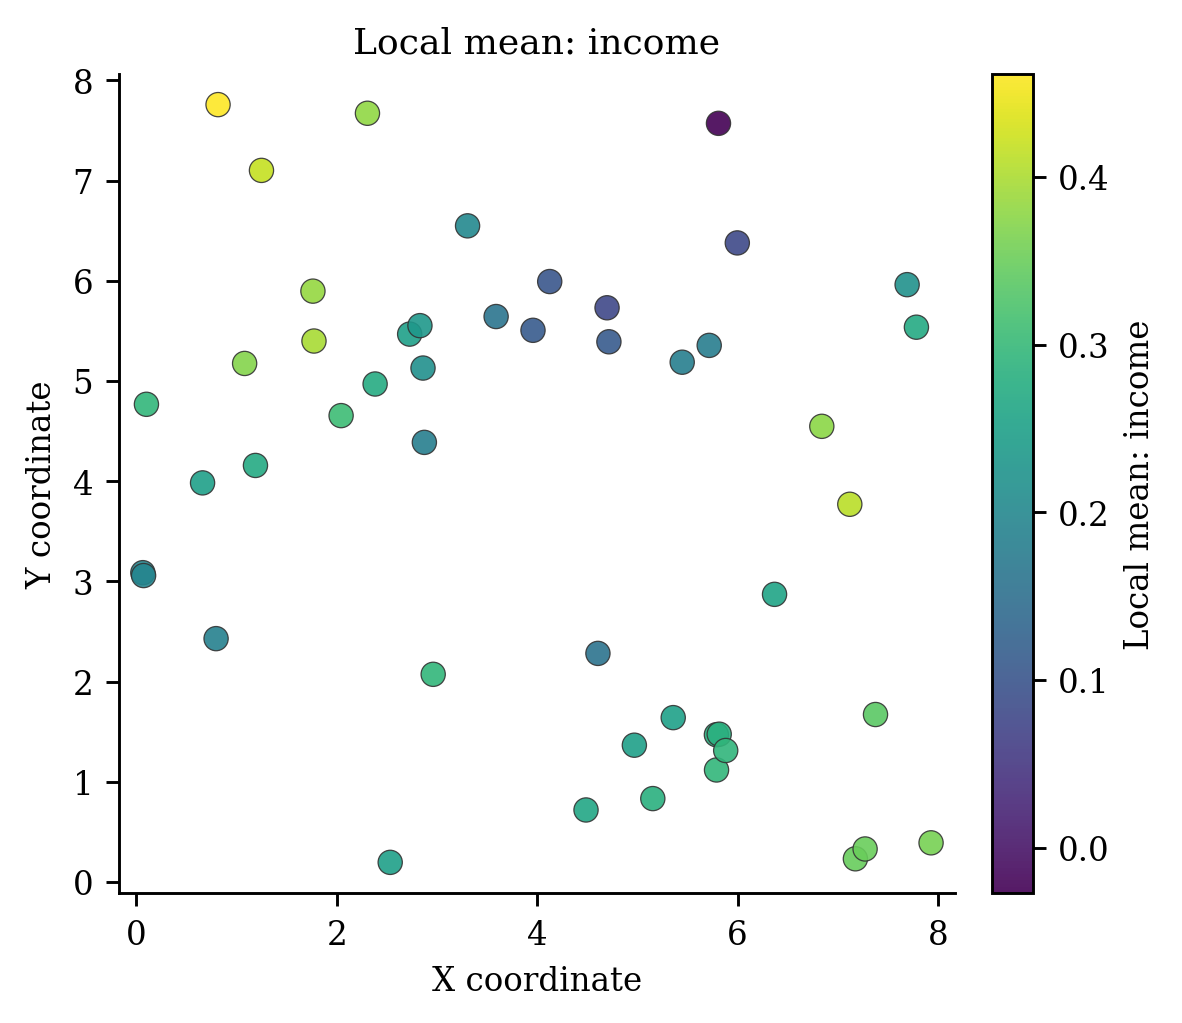
    "gwss_mean.png": plot_gwss_statistic(gwss, "mean", "x1"),
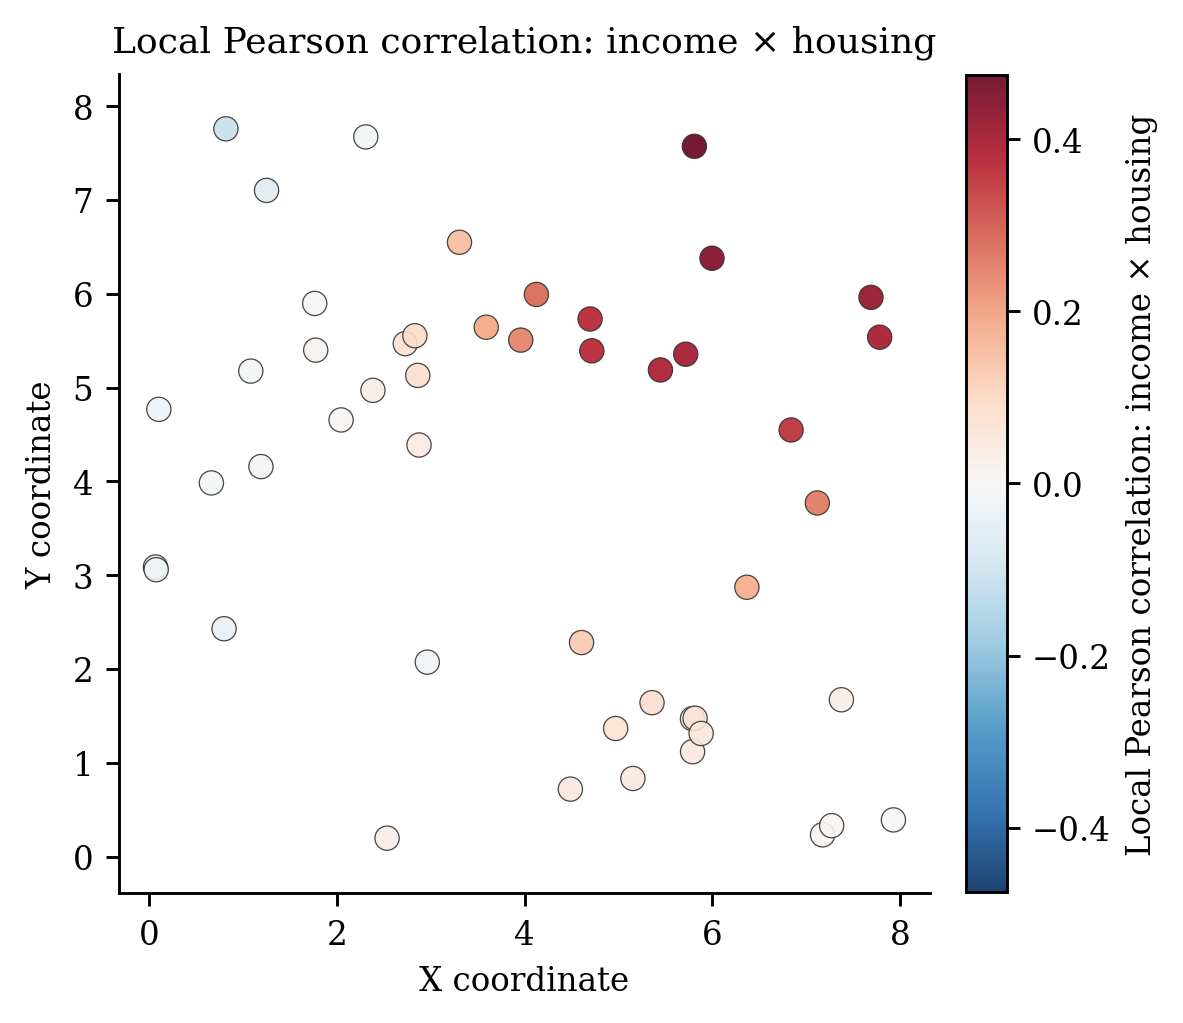
    "gwss_correlation.png": plot_gwss_statistic(
        gwss, "correlation", "x1", second_feature="x2"
    ),
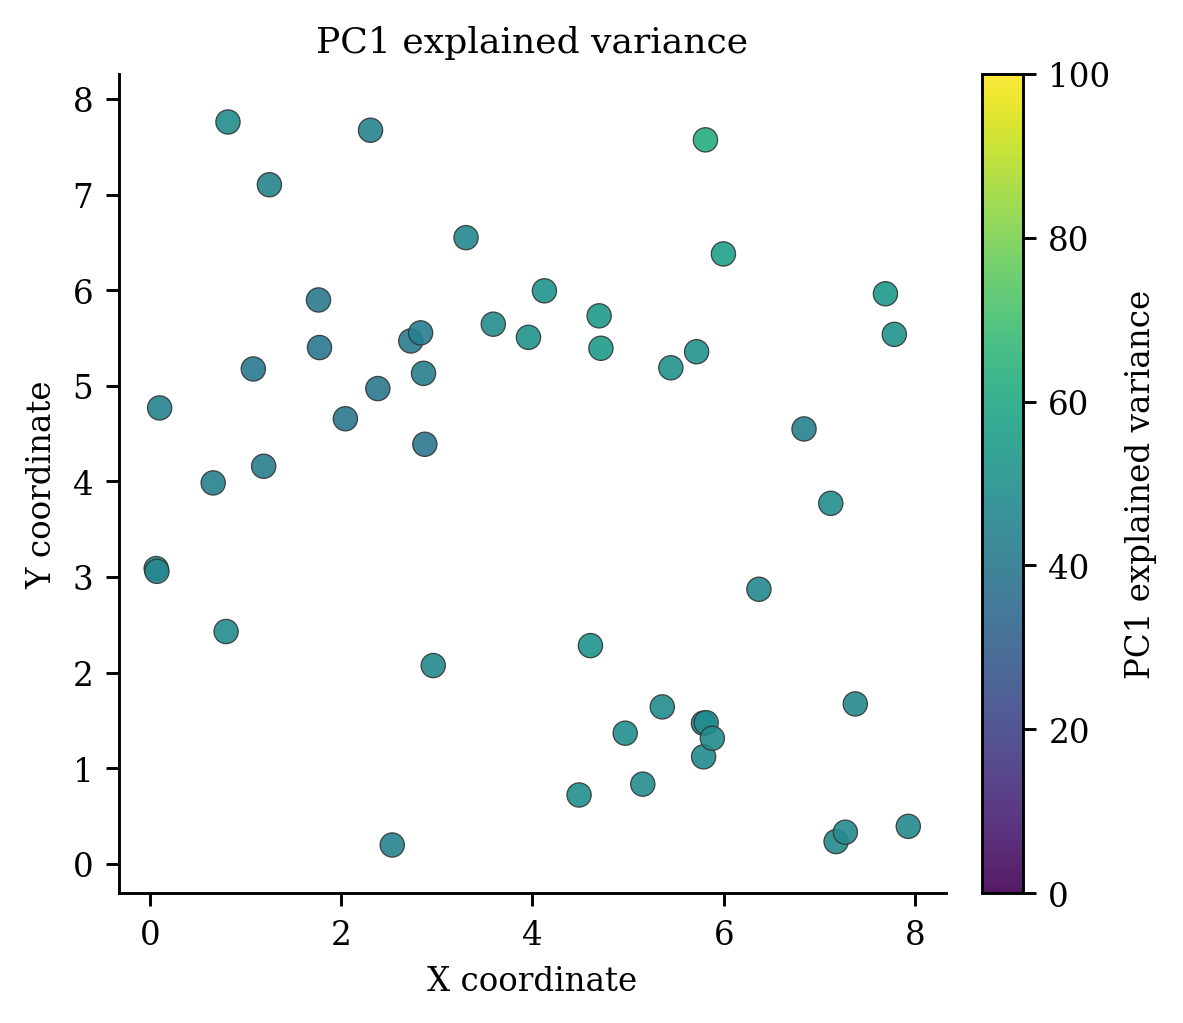
    "gwpca_variance.png": plot_gwpca_explained_variance(gwpca, 0),
    "gwpca_cumulative.png": plot_gwpca_explained_variance(gwpca, 0, cumulative=True),
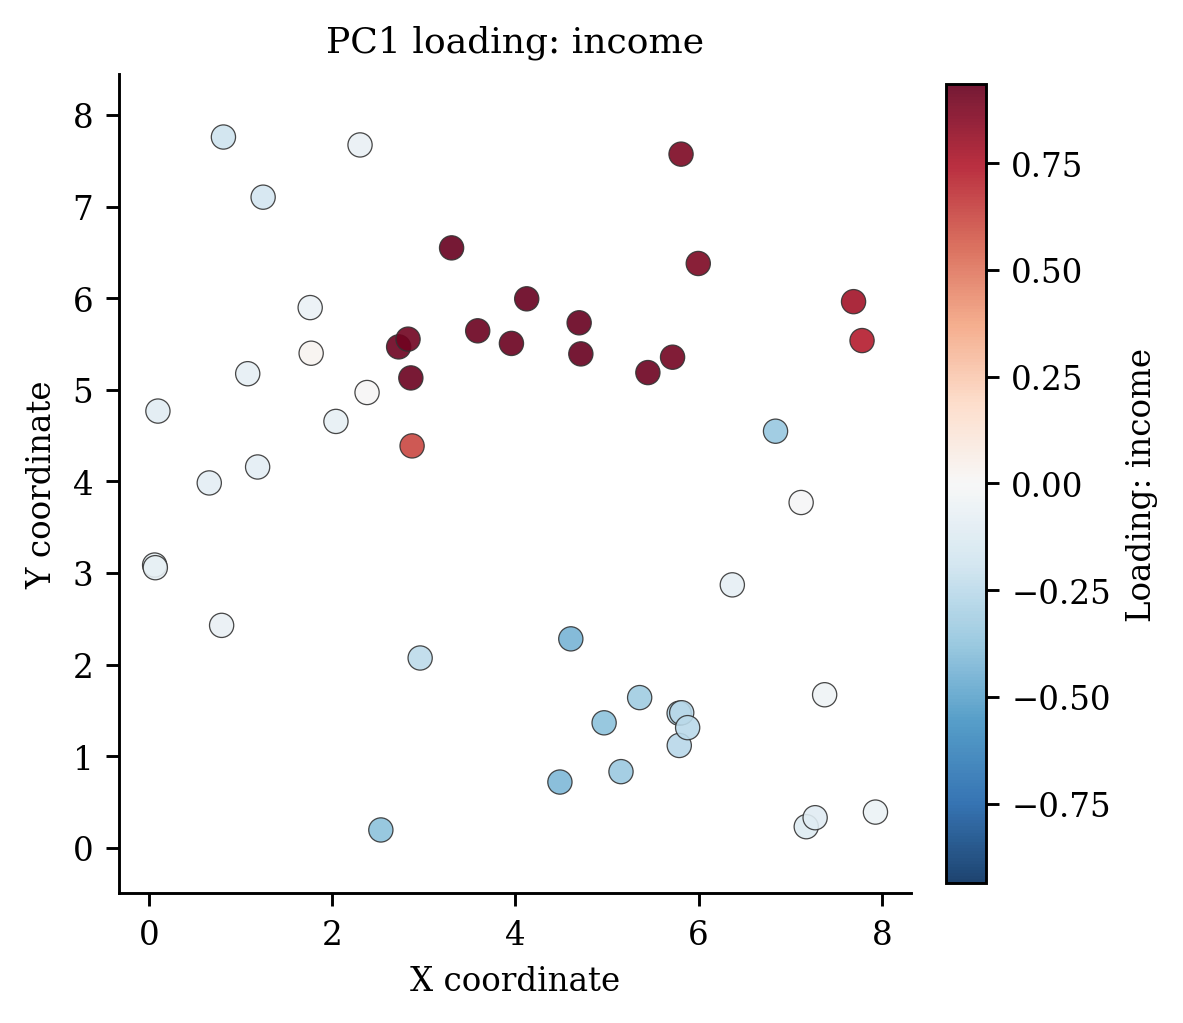
    "gwpca_loading.png": plot_gwpca_loading(gwpca, "x1", 0),
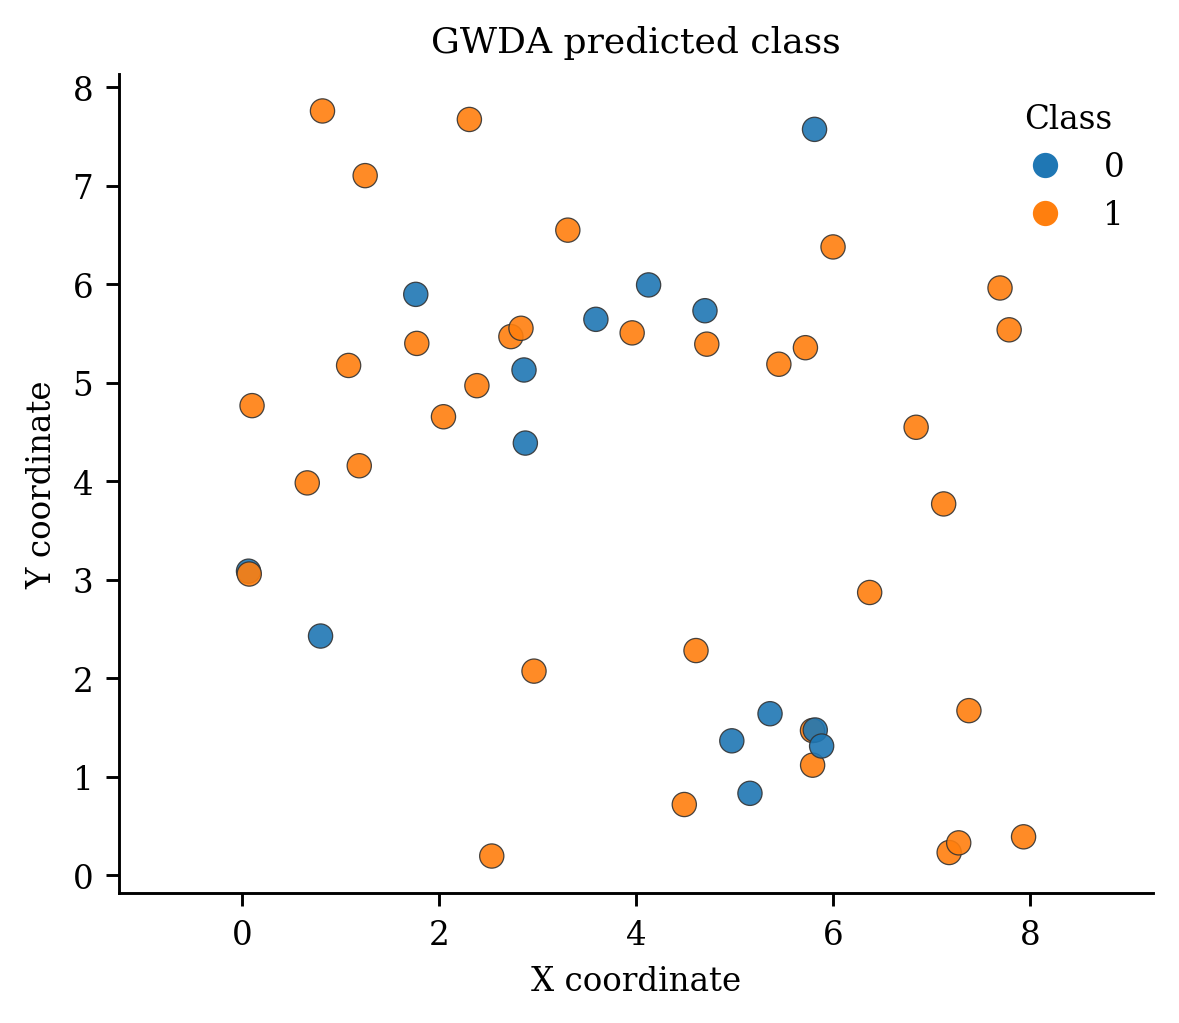
    "gwda_classification.png": plot_gwda_classification(gwda),
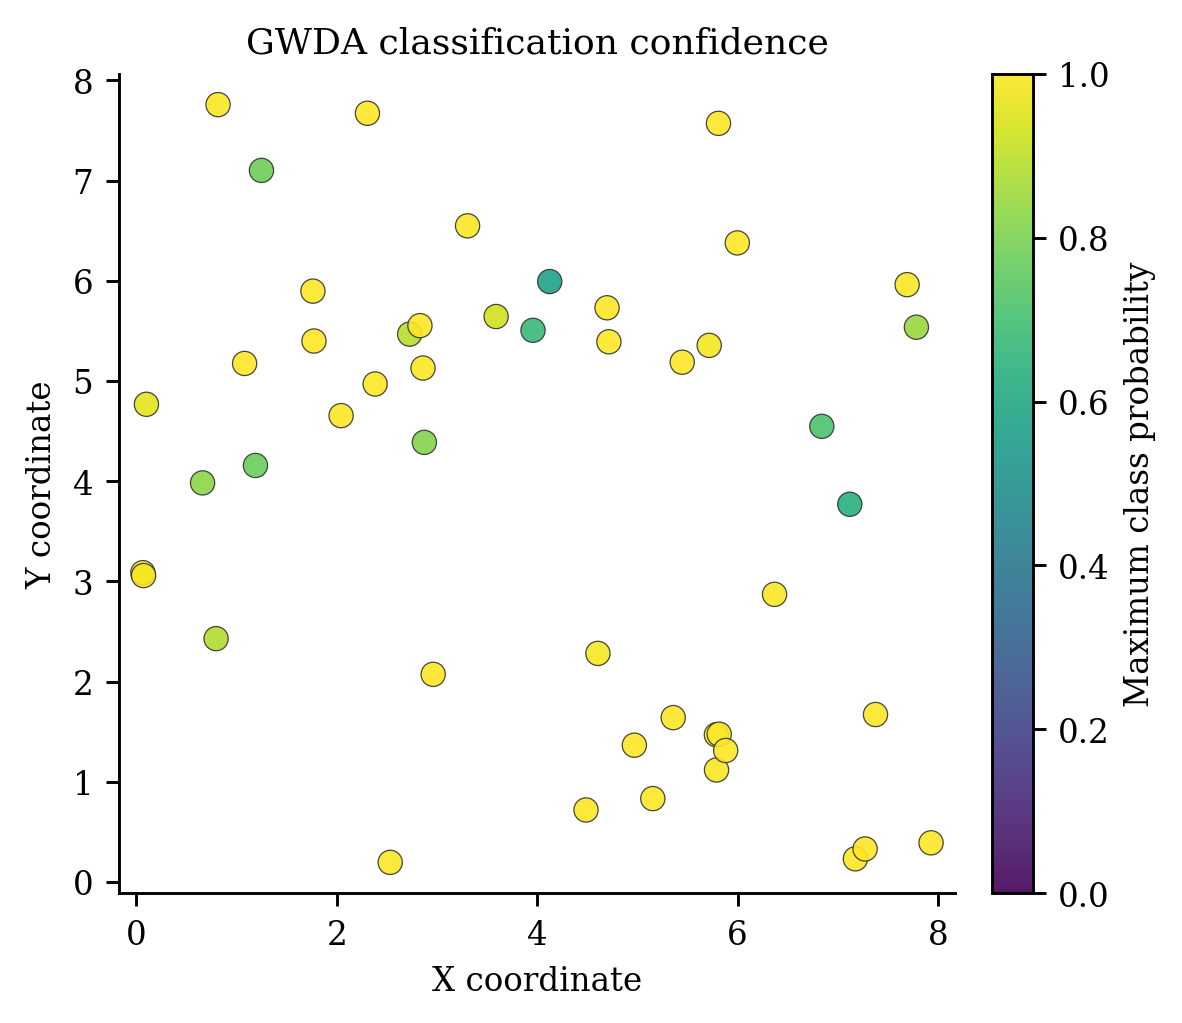
    "gwda_confidence.png": plot_gwda_classification(gwda, confidence=True),
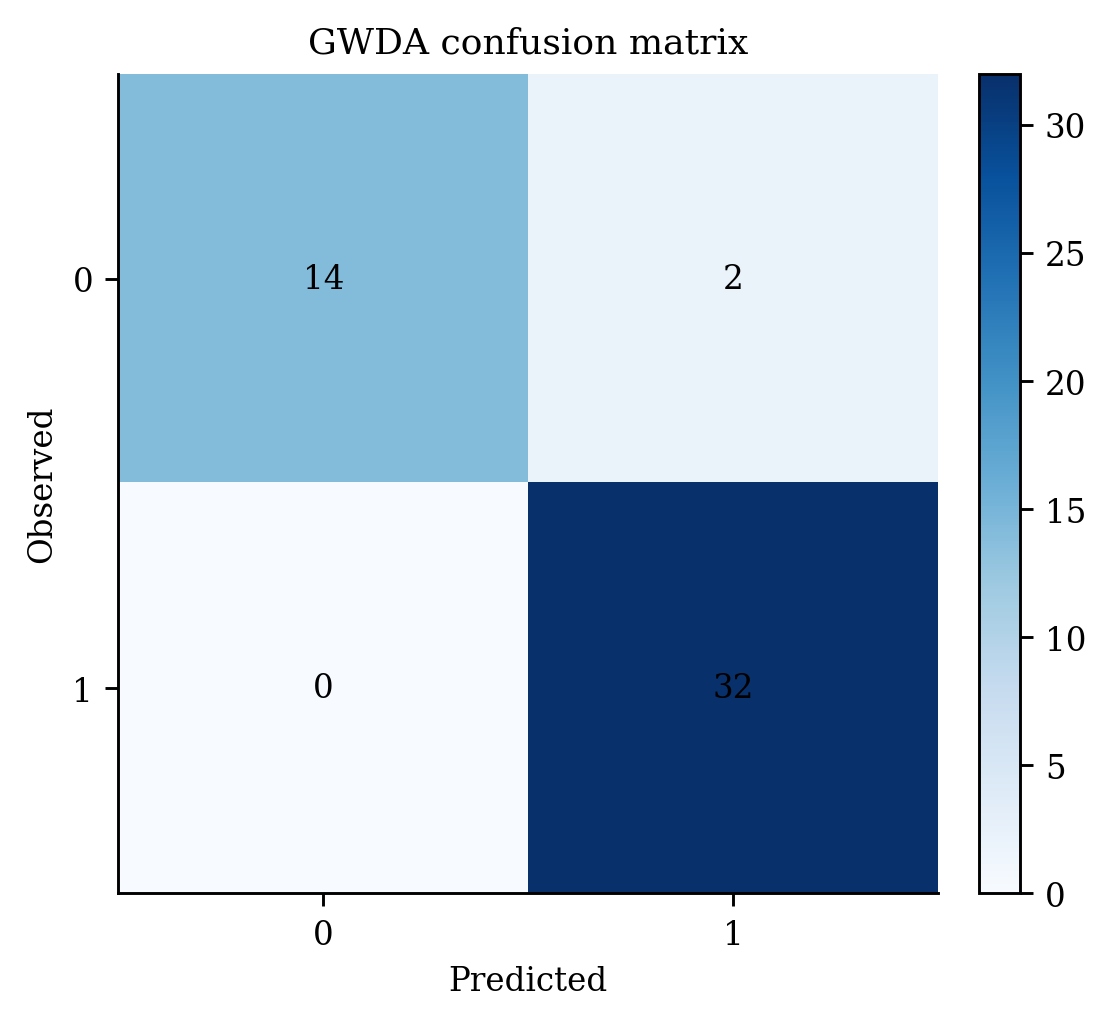
    "gwda_confusion.png": plot_gwda_confusion_matrix(gwda, normalize=True),
}
for name, result in plots.items():
    print(save_plot(result, name))
Temporal and weight plots
# SPDX-FileCopyrightText: 2026 Jinghao Hu
# SPDX-License-Identifier: MIT

"""All temporal, multiscale, weight decomposition, and selection-history plots."""

import matplotlib

matplotlib.use("Agg", force=True)
from pygwrx.plotting import (
    plot_mgtwr_scales,
    plot_selection_history,
    plot_temporal_bandwidths,
    plot_temporal_coefficient_slices,
    plot_temporal_residuals,
    plot_temporal_trajectory,
    plot_weight_decomposition,
    plot_weight_profiles,
)
from _common import save_plot
from _models import temporal_models

X, y, coords, times, gtwr, mgtwr, sgtwr, sgwr, stwr, search_model = temporal_models()
plots = {
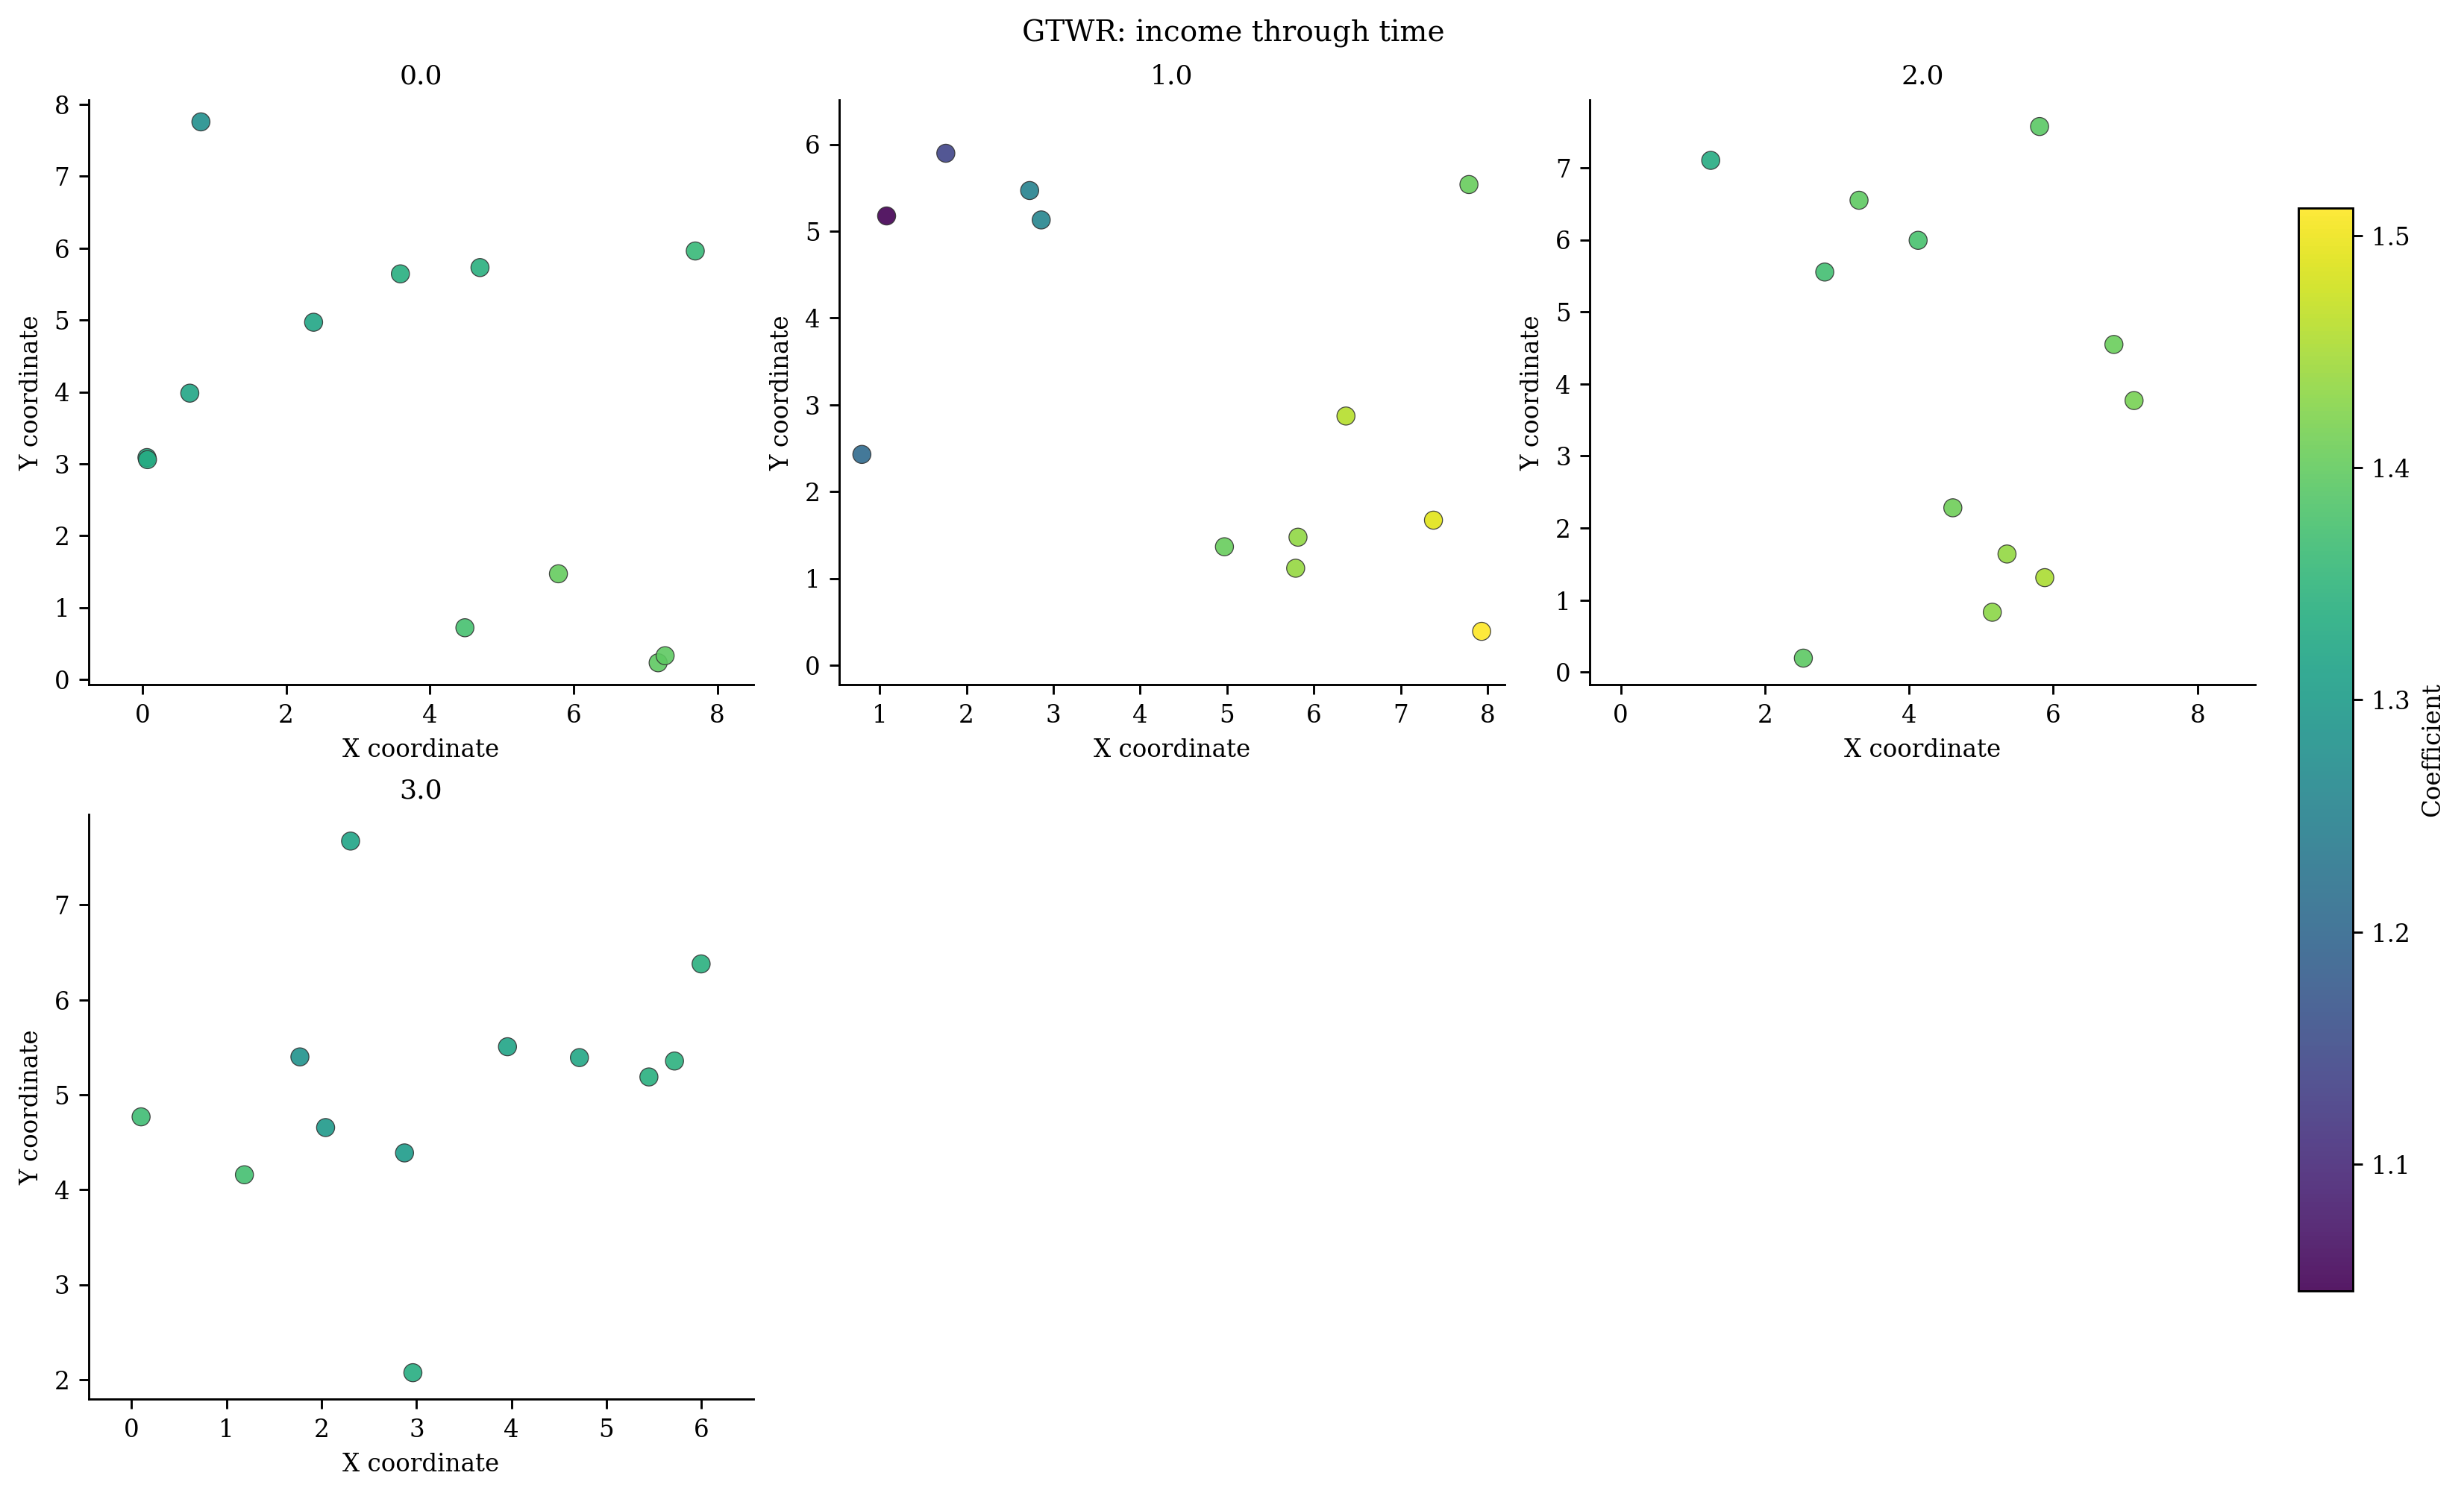
    "temporal_slices.png": plot_temporal_coefficient_slices(gtwr, "x1"),
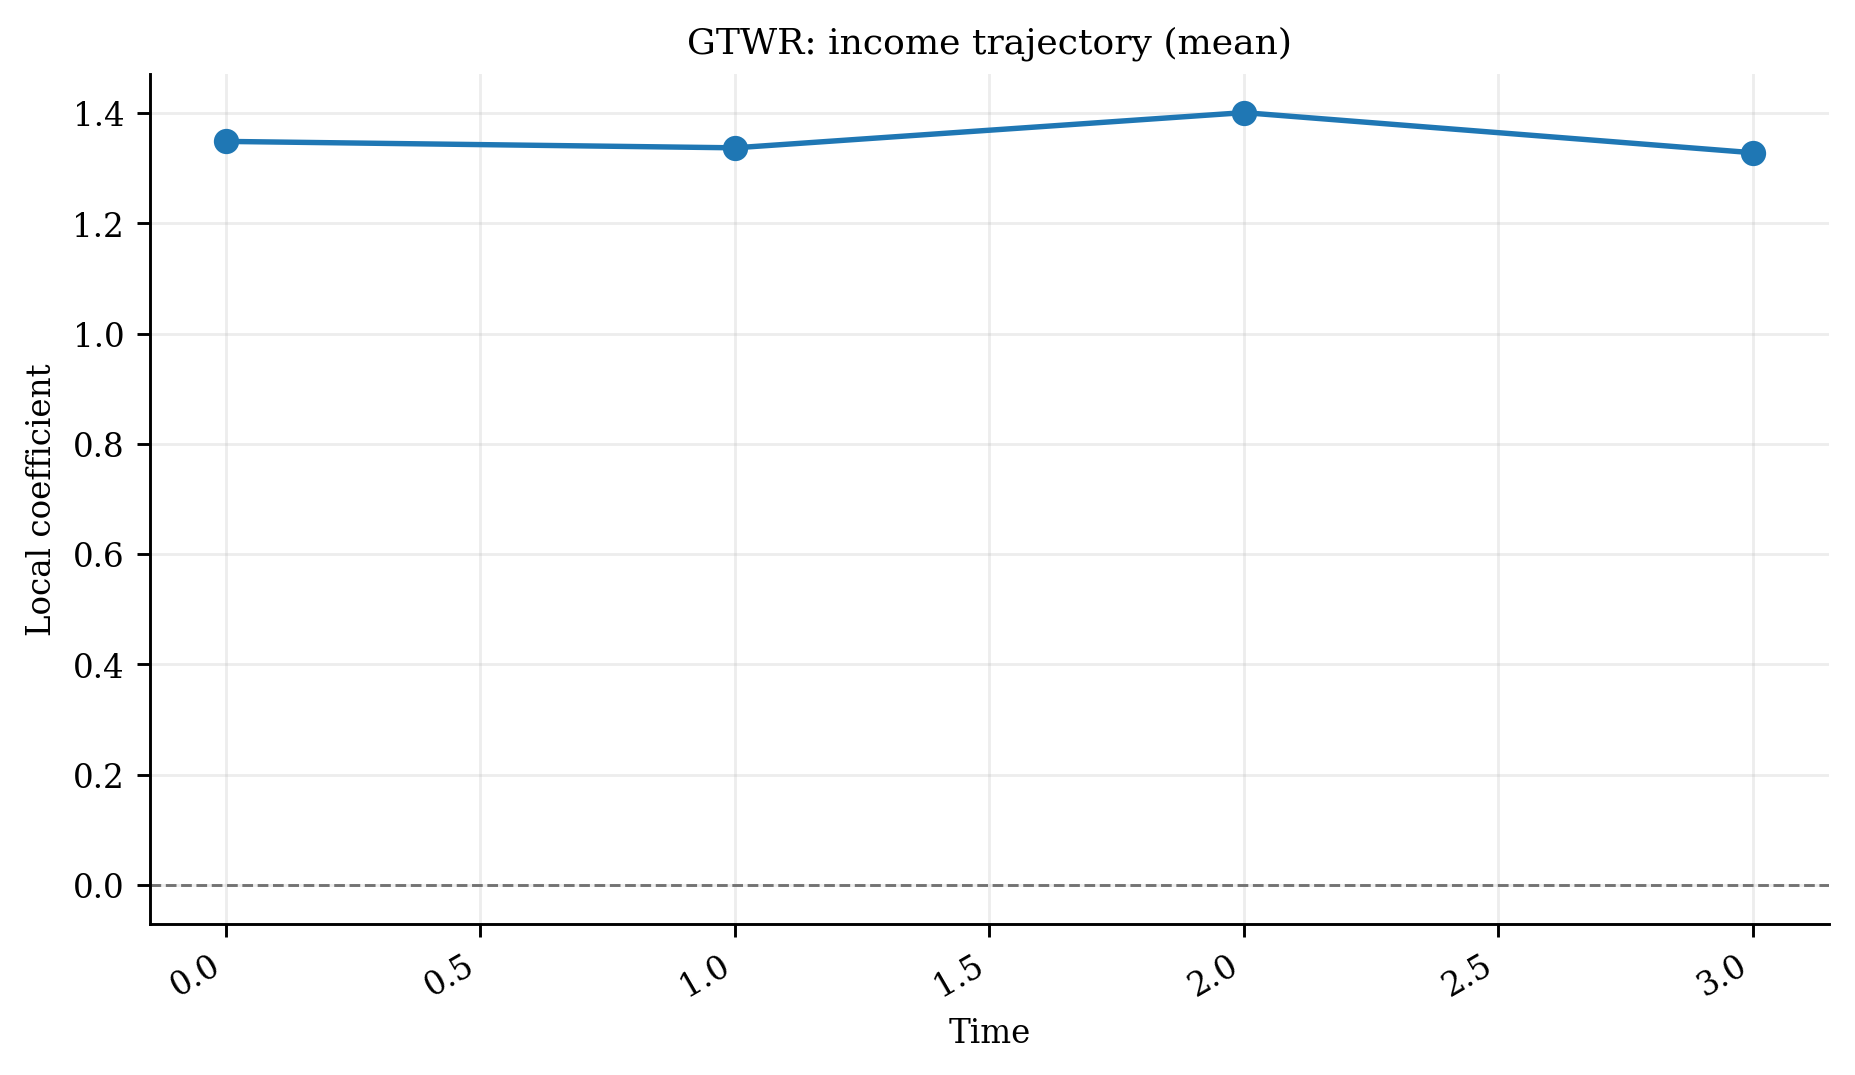
    "temporal_trajectory.png": plot_temporal_trajectory(gtwr, "x1"),
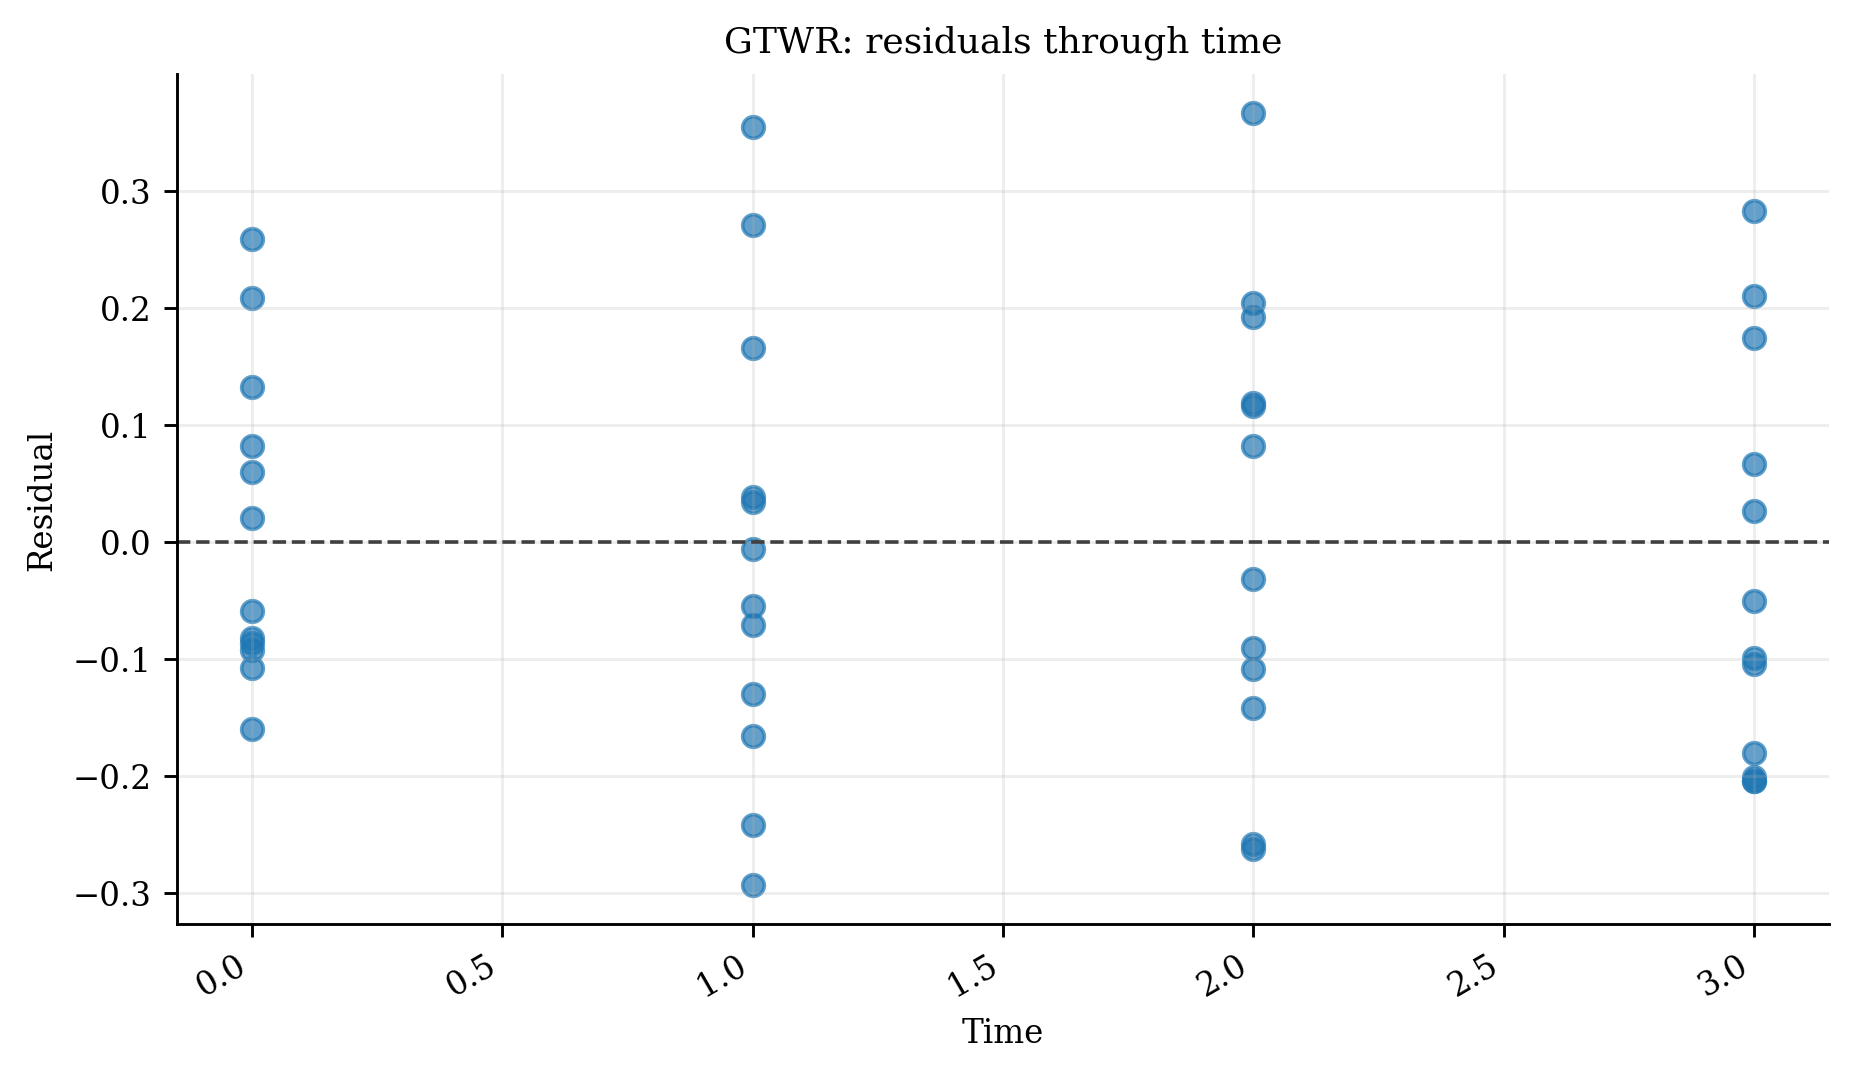
    "temporal_residuals.png": plot_temporal_residuals(gtwr),
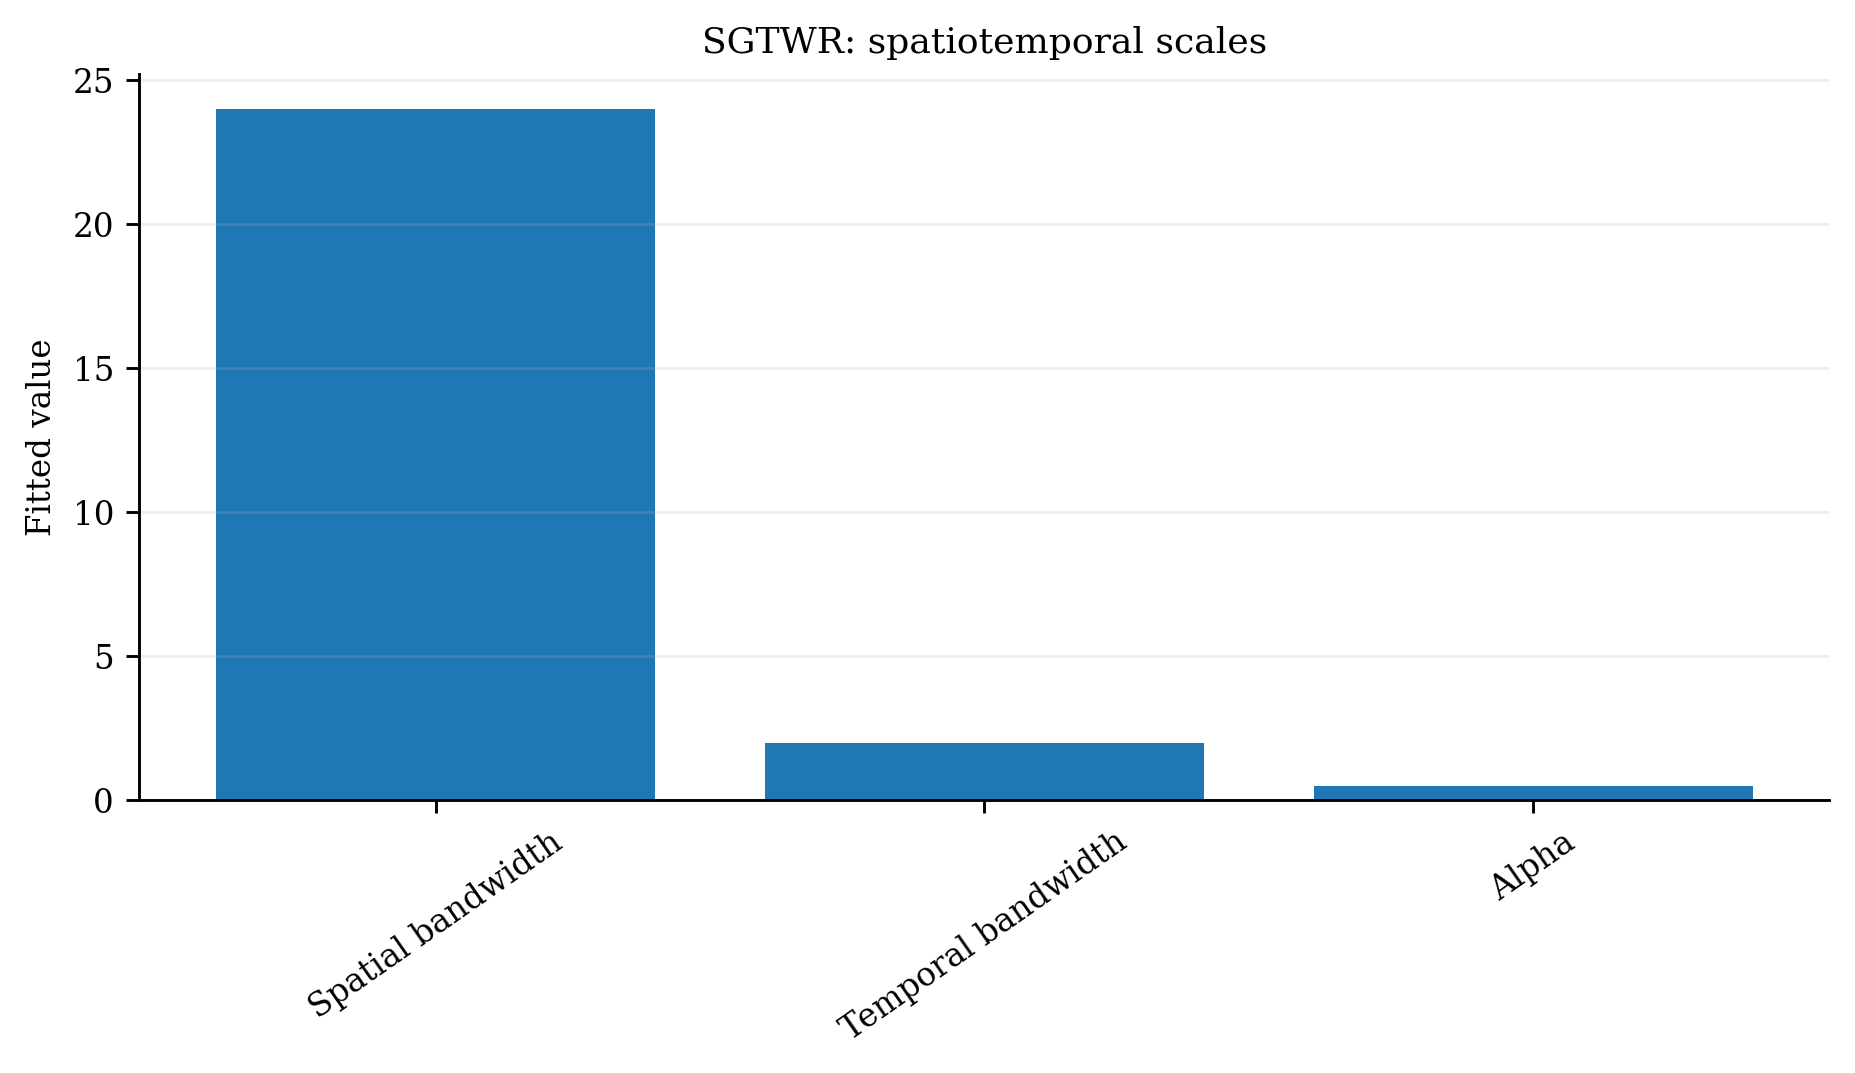
    "temporal_bandwidths.png": plot_temporal_bandwidths(sgtwr),
    "mgtwr_scales.png": plot_mgtwr_scales(mgtwr),
    "sgwr_decomposition.png": plot_weight_decomposition(sgwr, 0),
    "sgwr_profiles.png": plot_weight_profiles(sgwr, 0, sort_by="combined"),
    "stwr_decomposition.png": plot_weight_decomposition(stwr, 0),
    "sgtwr_decomposition.png": plot_weight_decomposition(sgtwr, 0),
    "selection_history.png": plot_selection_history(search_model),
}
for name, result in plots.items():
    print(save_plot(result, name))
LGGWR and GRGWR
# SPDX-FileCopyrightText: 2026 Jinghao Hu
# SPDX-License-Identifier: MIT

"""All visualization functions for the two original research models."""

import matplotlib

matplotlib.use("Agg", force=True)
from pygwrx.plotting import (
    plot_grgwr_coefficient_surface,
    plot_grgwr_convergence,
    plot_grgwr_regime_sizes,
    plot_grgwr_regimes,
    plot_lggwr_latent_geometry,
    plot_lggwr_metric_matrix,
    plot_lggwr_neighbourhood_comparison,
    plot_lggwr_training,
)
from _common import save_plot
from _models import original_models

lggwr, grgwr = original_models()
plots = {
    "lggwr_geometry.png": plot_lggwr_latent_geometry(lggwr),
    "lggwr_metric.png": plot_lggwr_metric_matrix(lggwr),
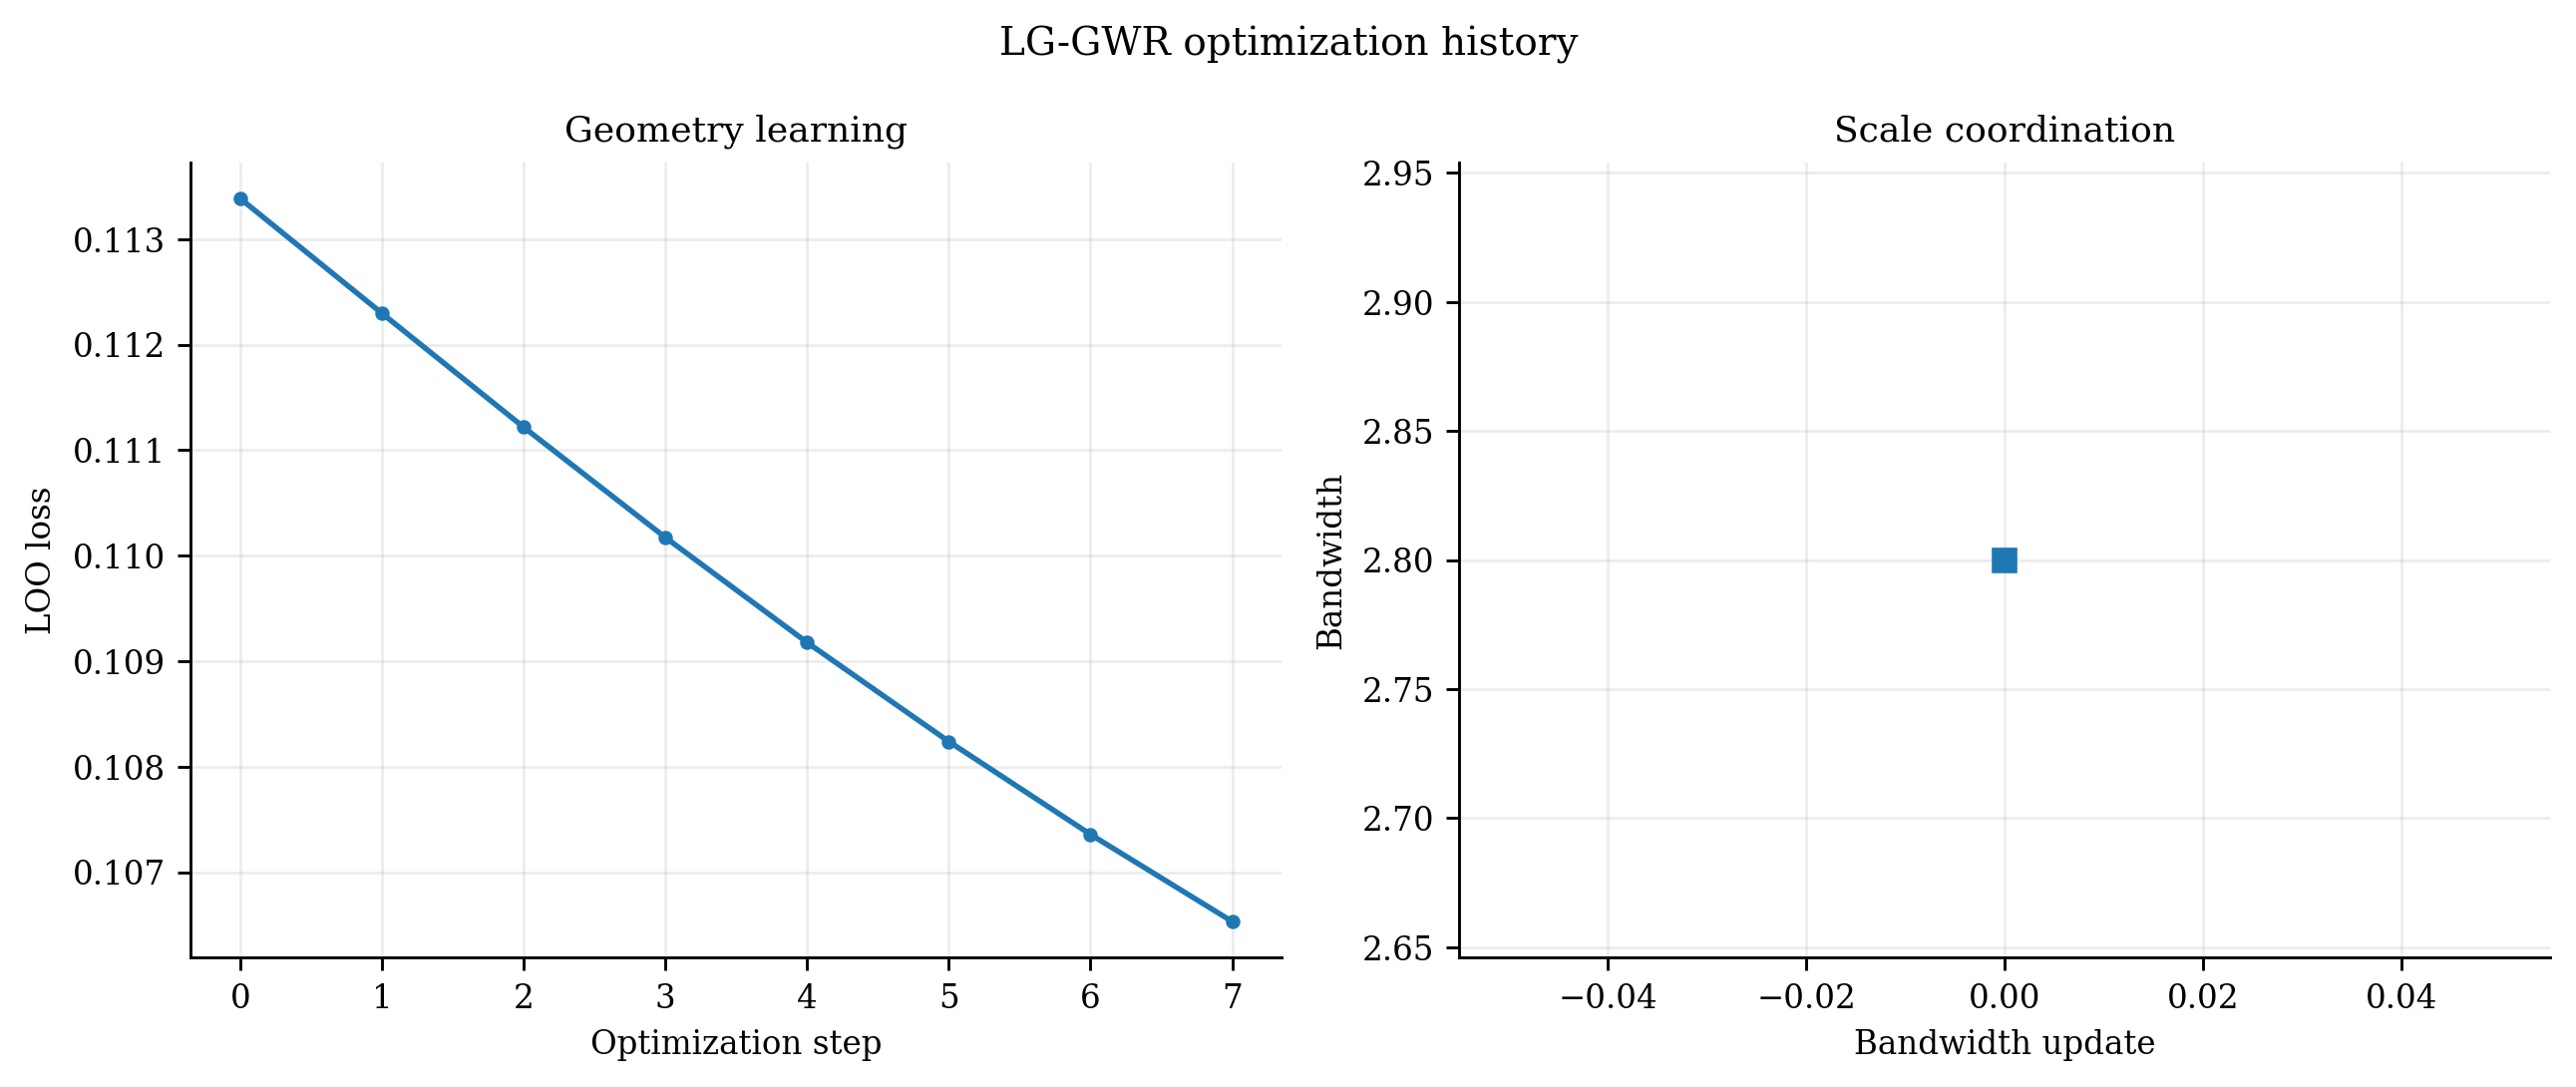
    "lggwr_training.png": plot_lggwr_training(lggwr),
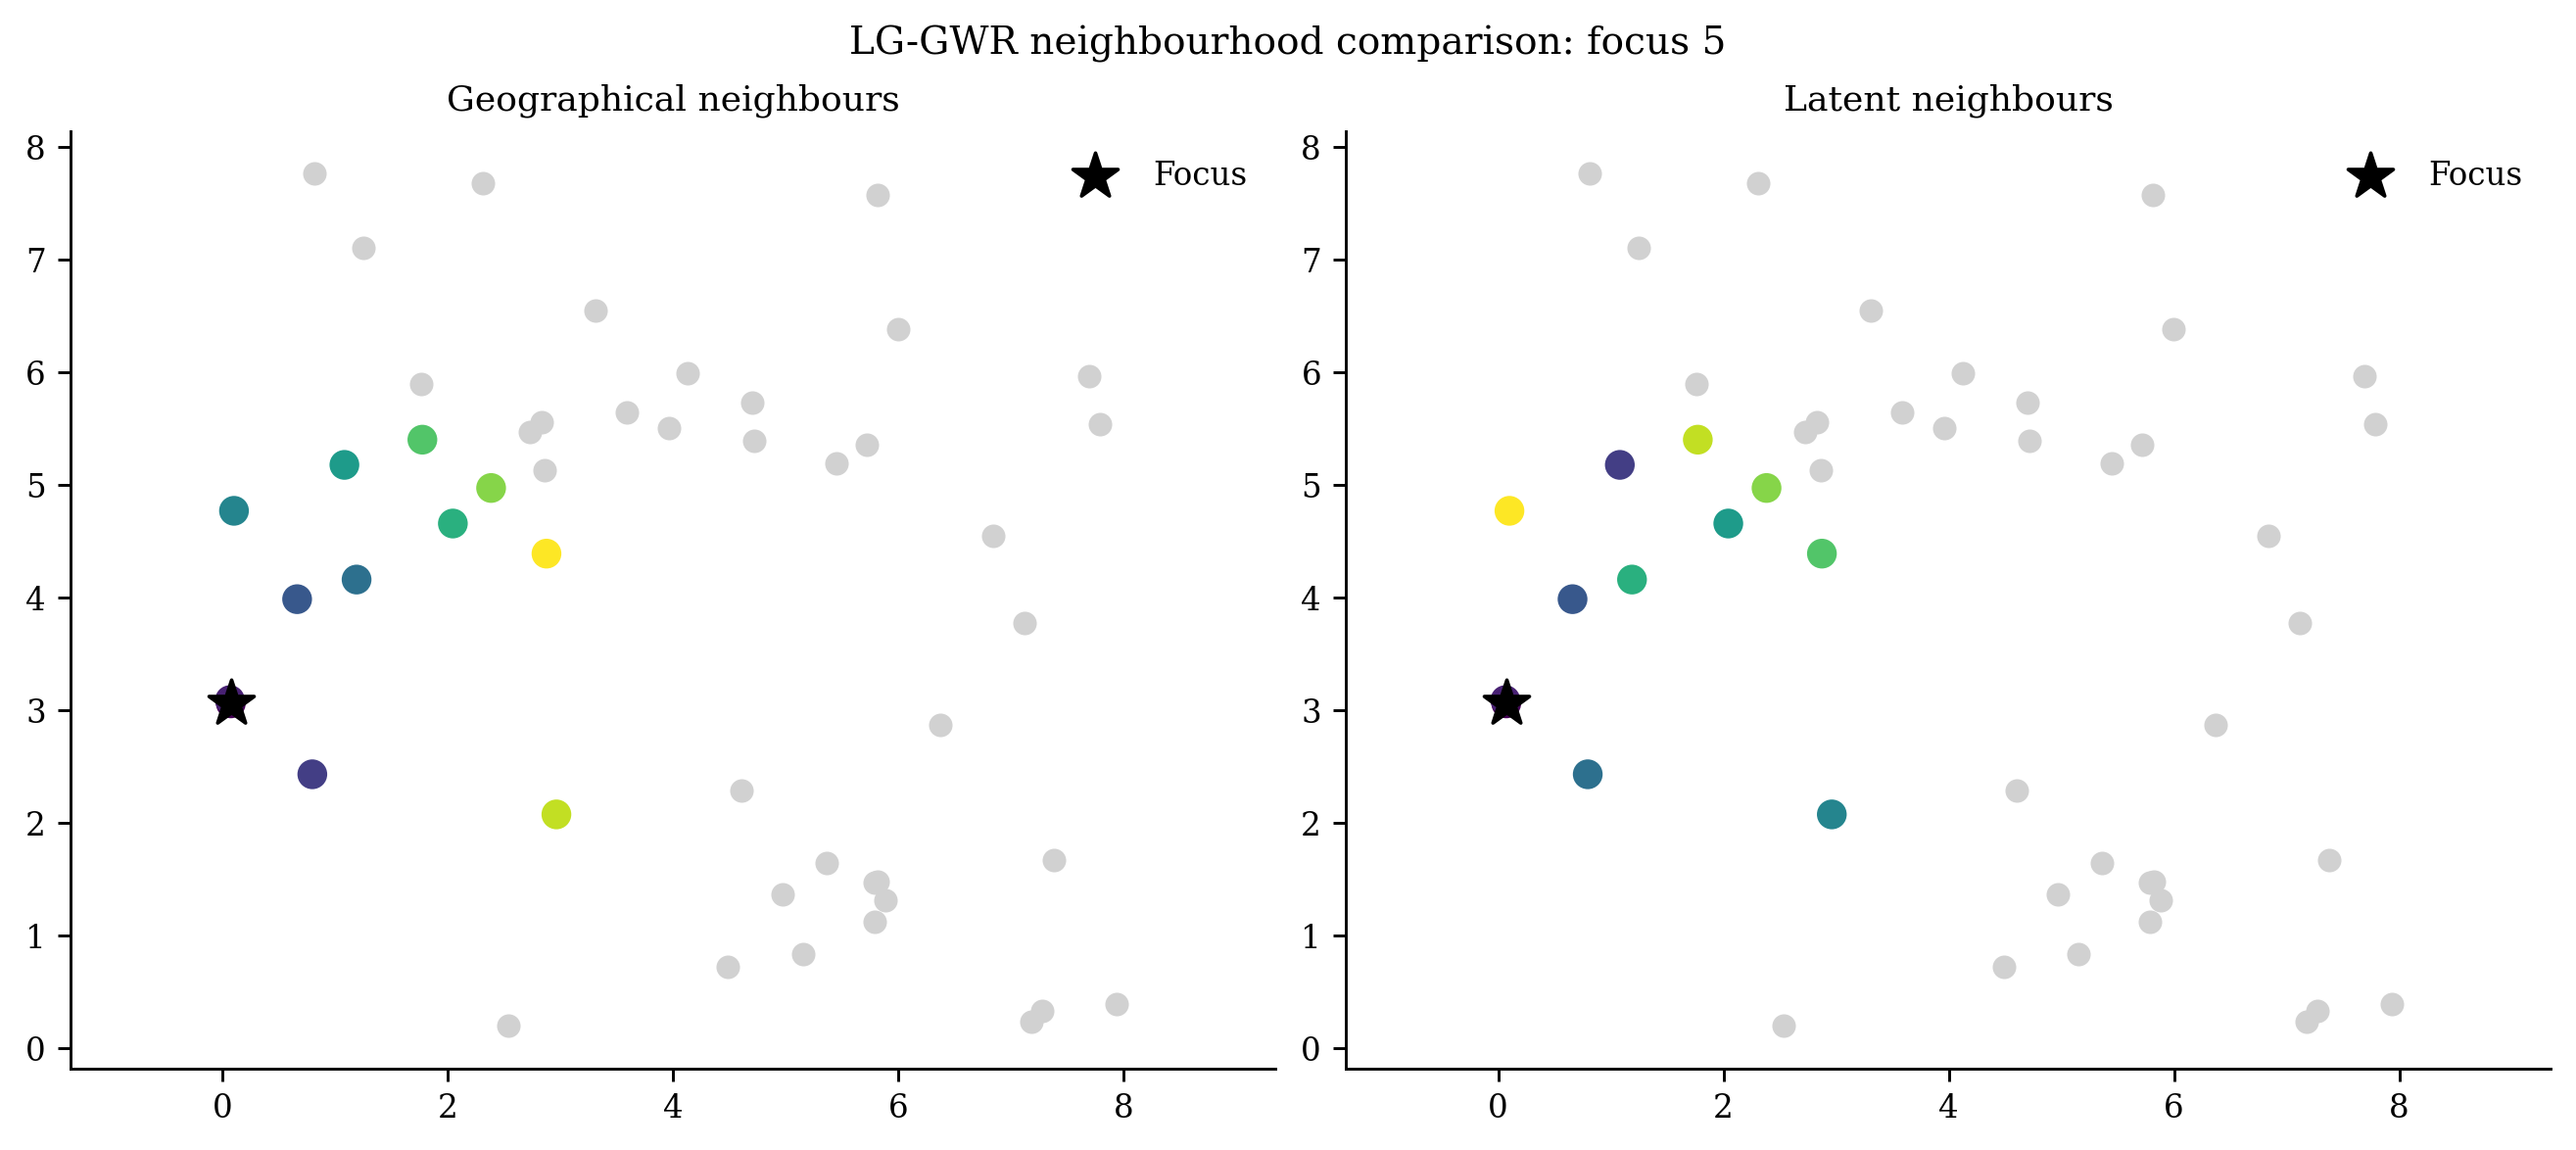
    "lggwr_neighbours.png": plot_lggwr_neighbourhood_comparison(lggwr, 0),
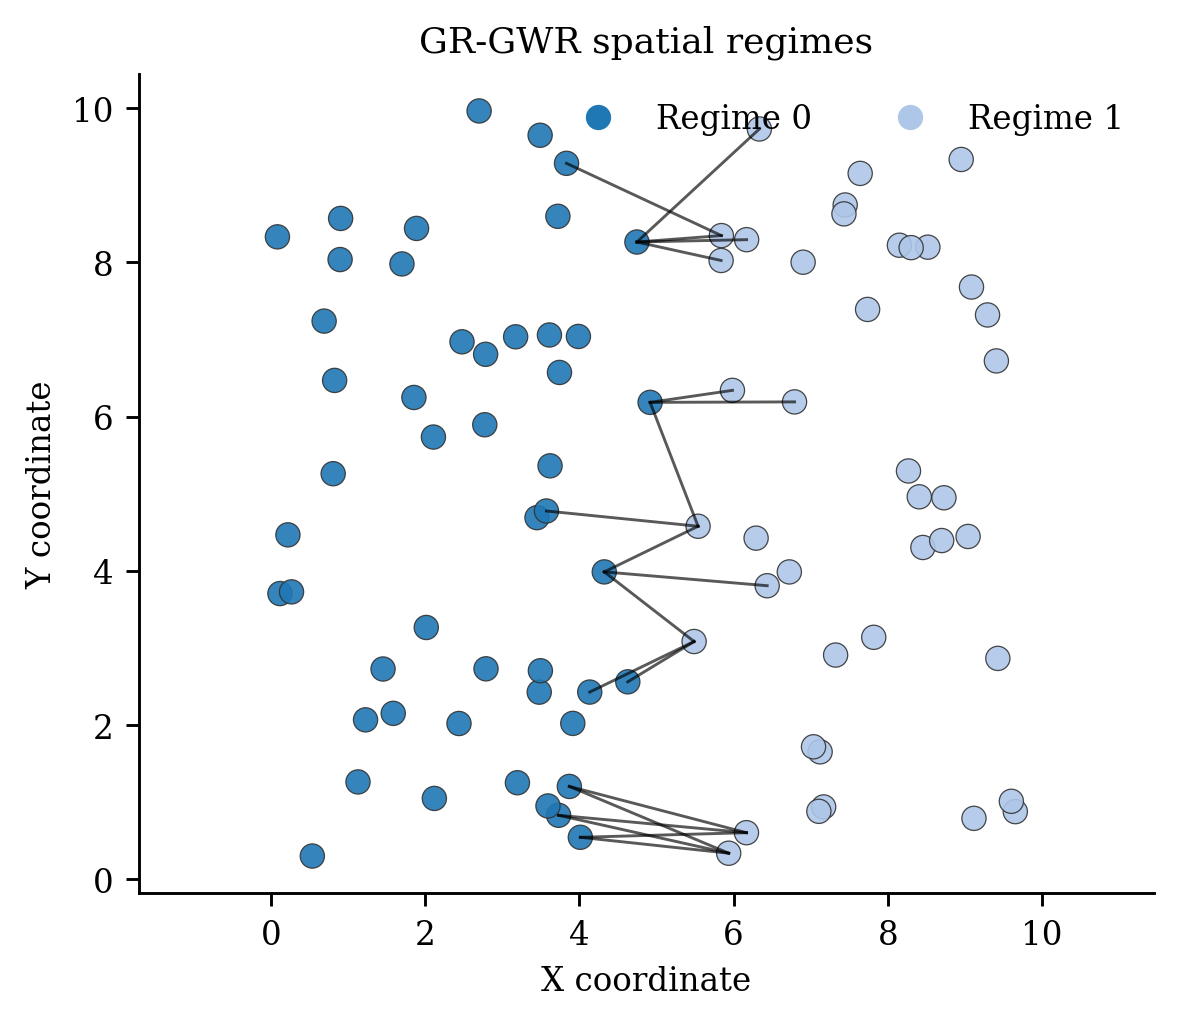
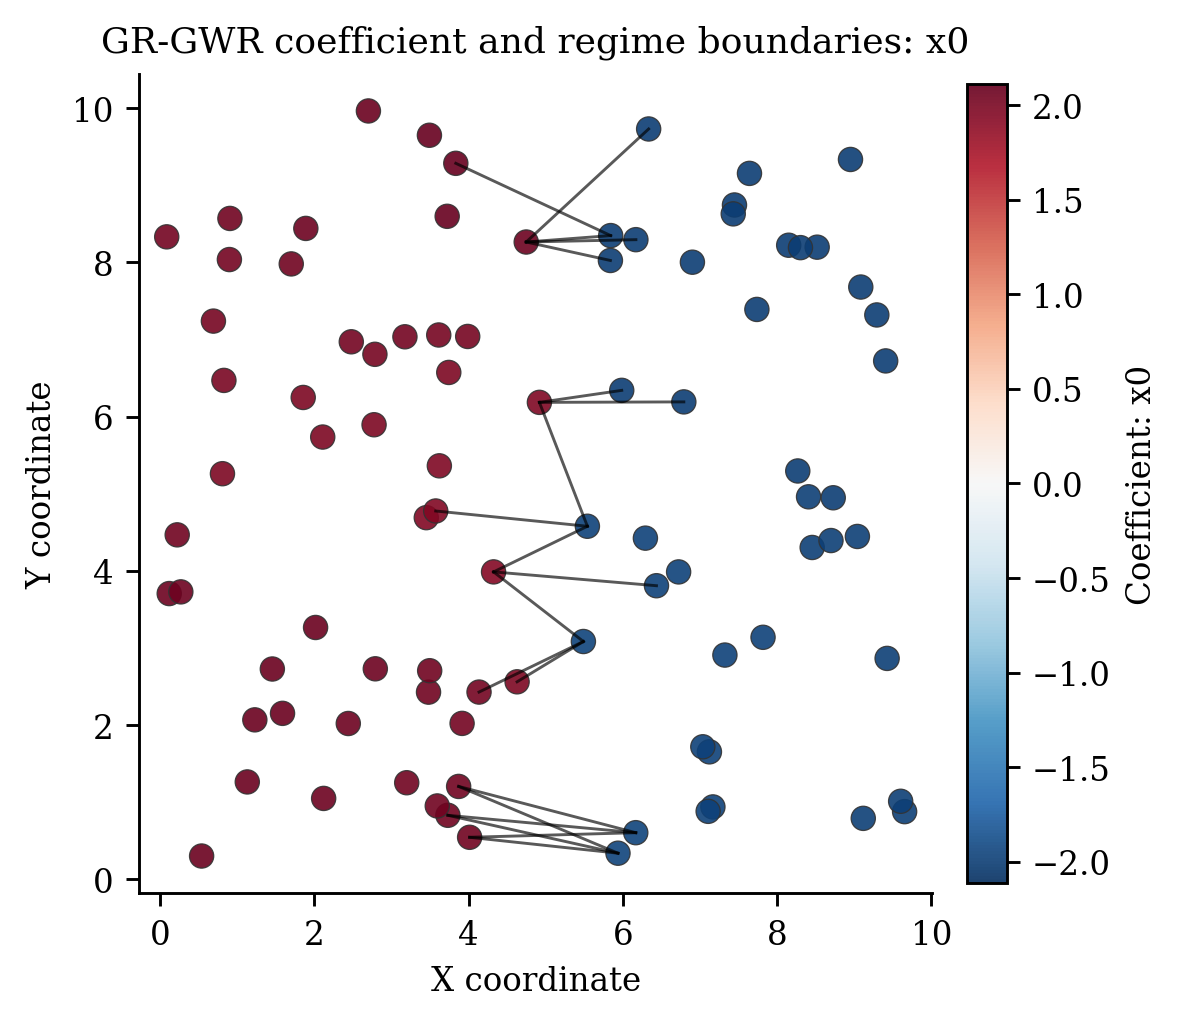
    "grgwr_regimes.png": plot_grgwr_regimes(grgwr),
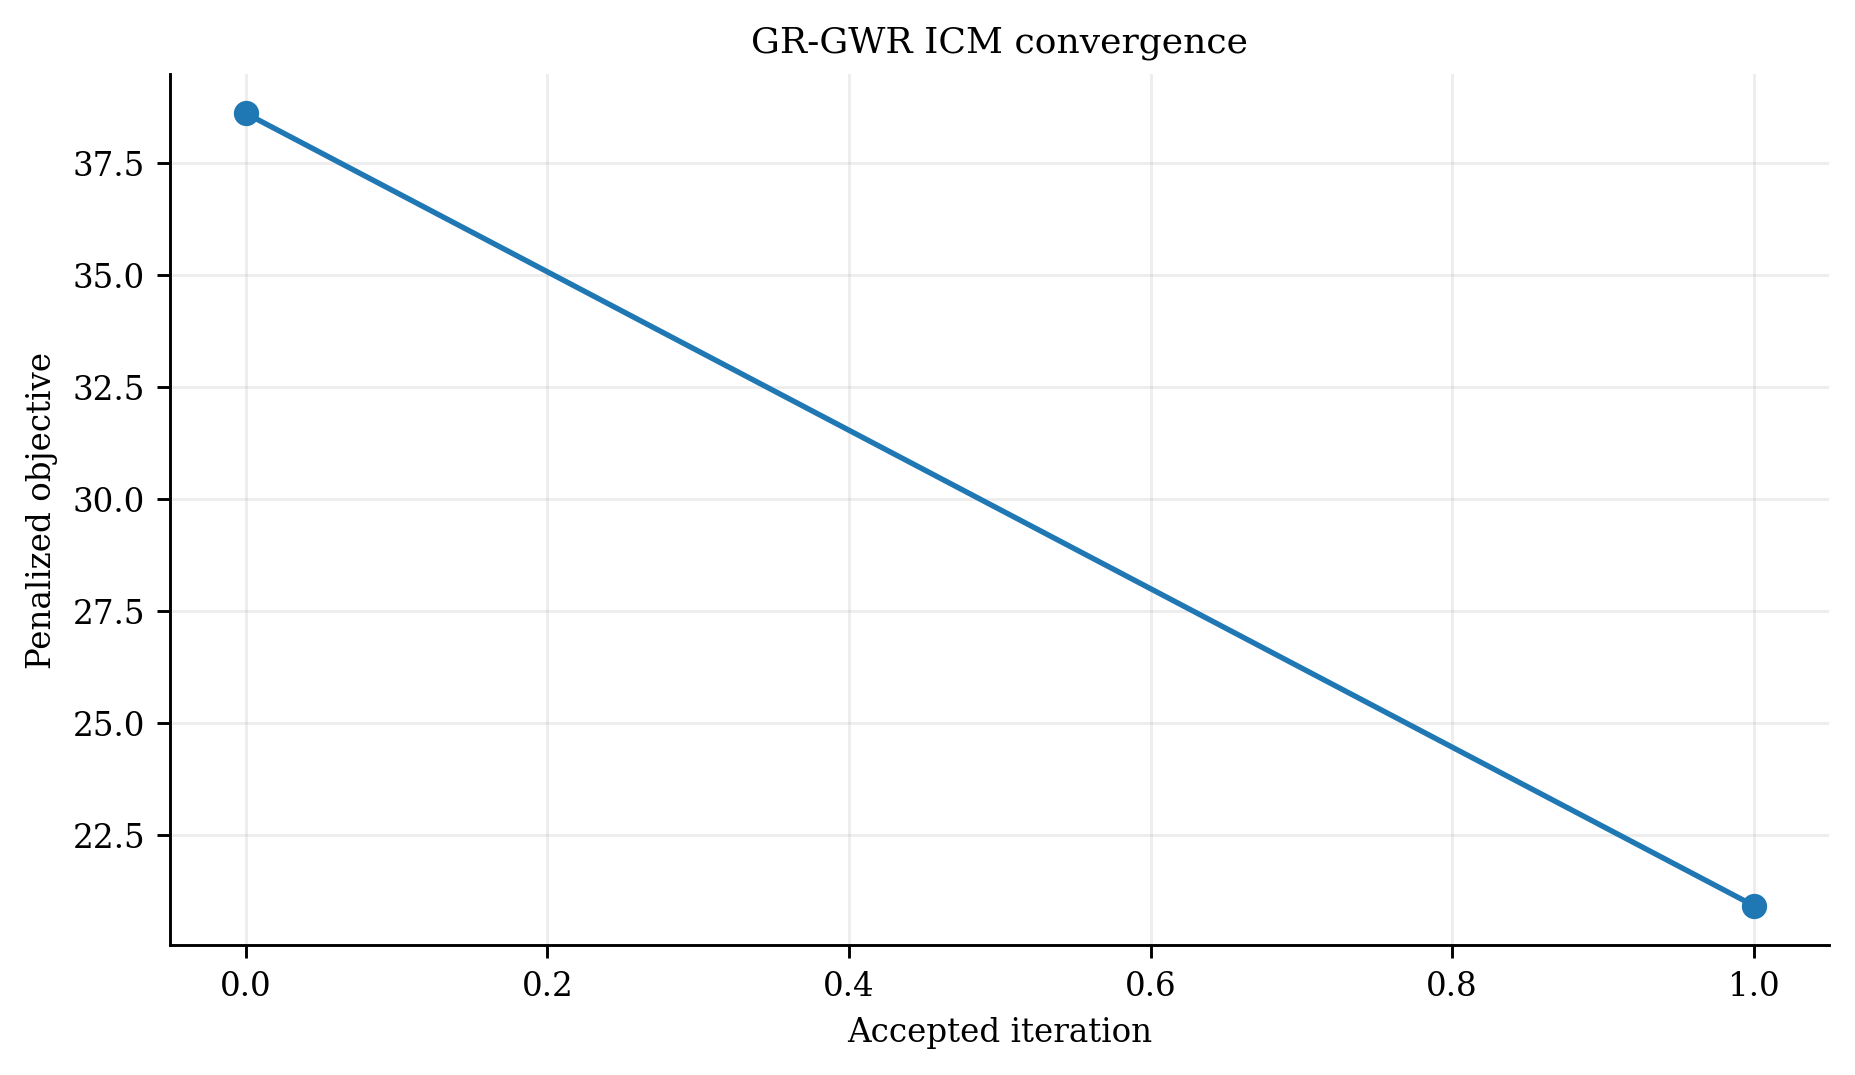
    "grgwr_convergence.png": plot_grgwr_convergence(grgwr),
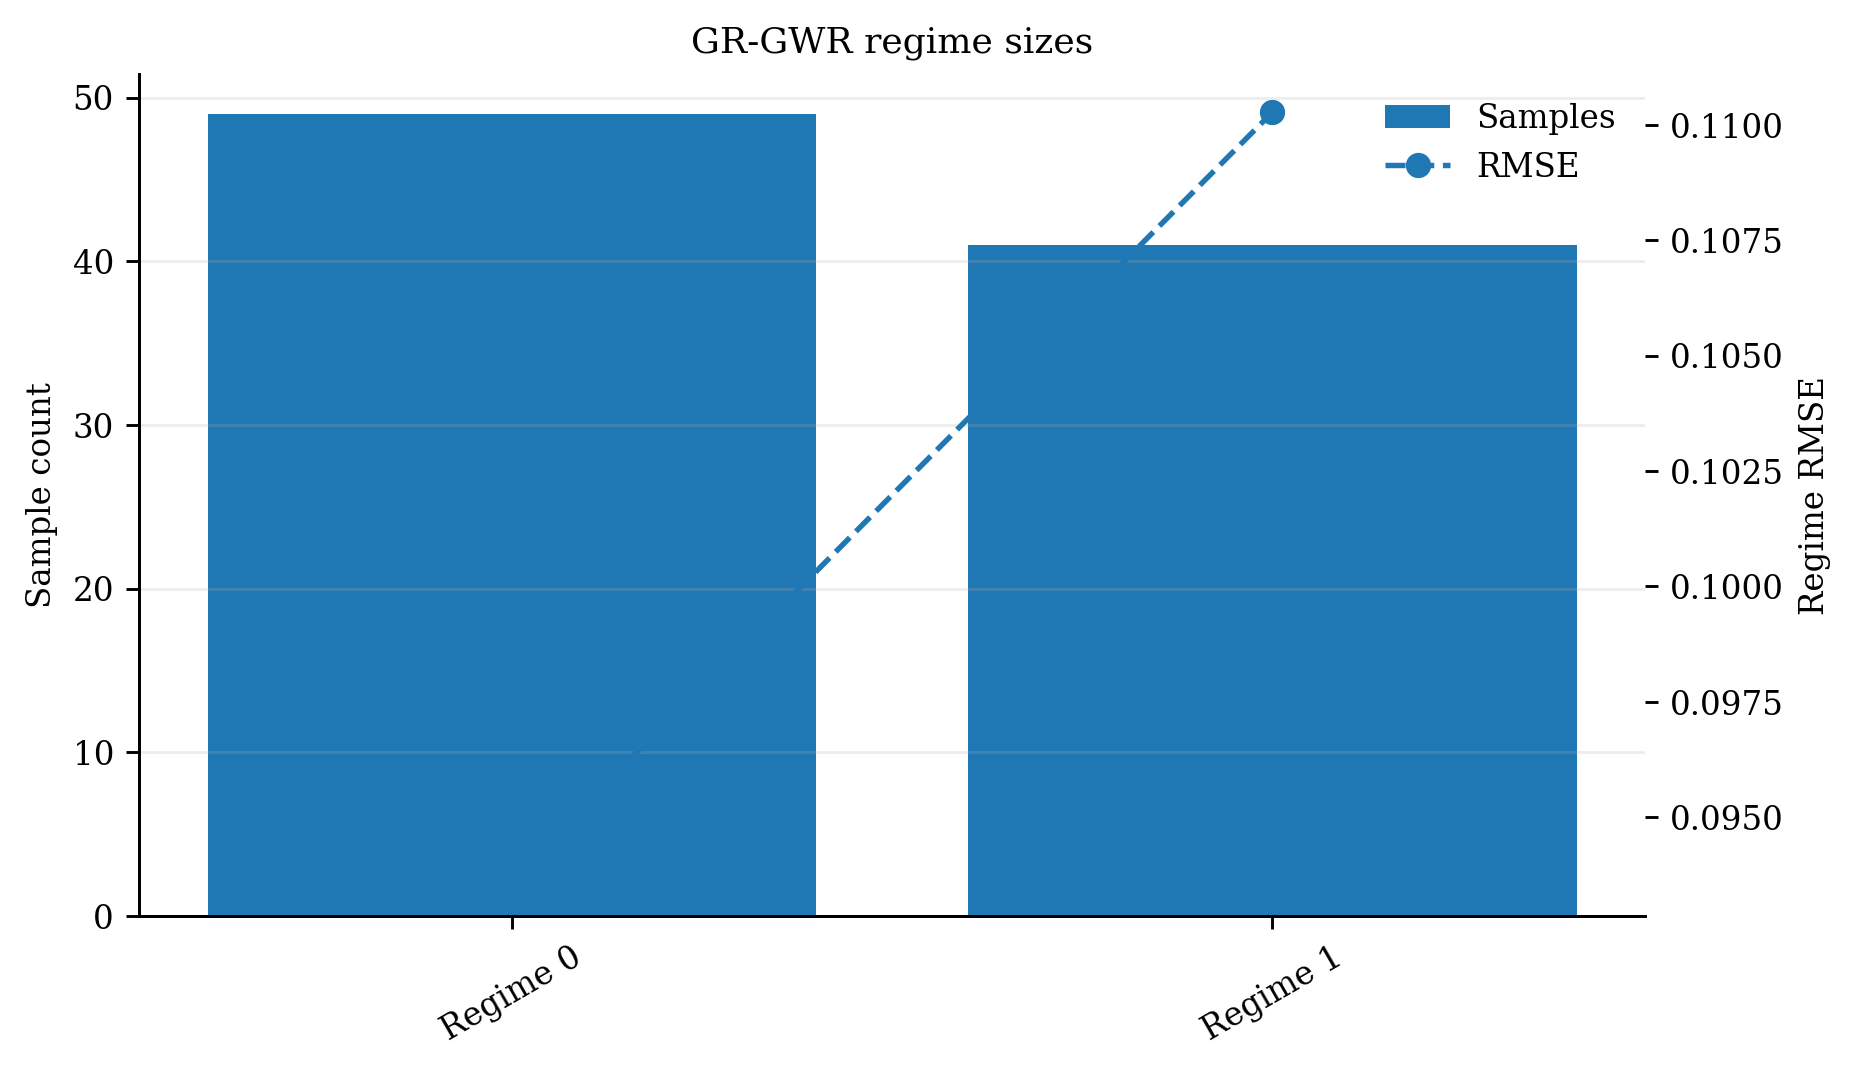
    "grgwr_sizes.png": plot_grgwr_regime_sizes(grgwr),
    "grgwr_surface.png": plot_grgwr_coefficient_surface(grgwr, "x1"),
}
for name, result in plots.items():
    print(save_plot(result, name))
Figure gallery
See the Plotting API for every function signature and mapped example.